29
/es/
es
AIzaSyAYiBZKx7MnpbEhh9jyipgxe19OcubqV5w
April 1, 2024
261183
Tanzania
TZA
true
2
1
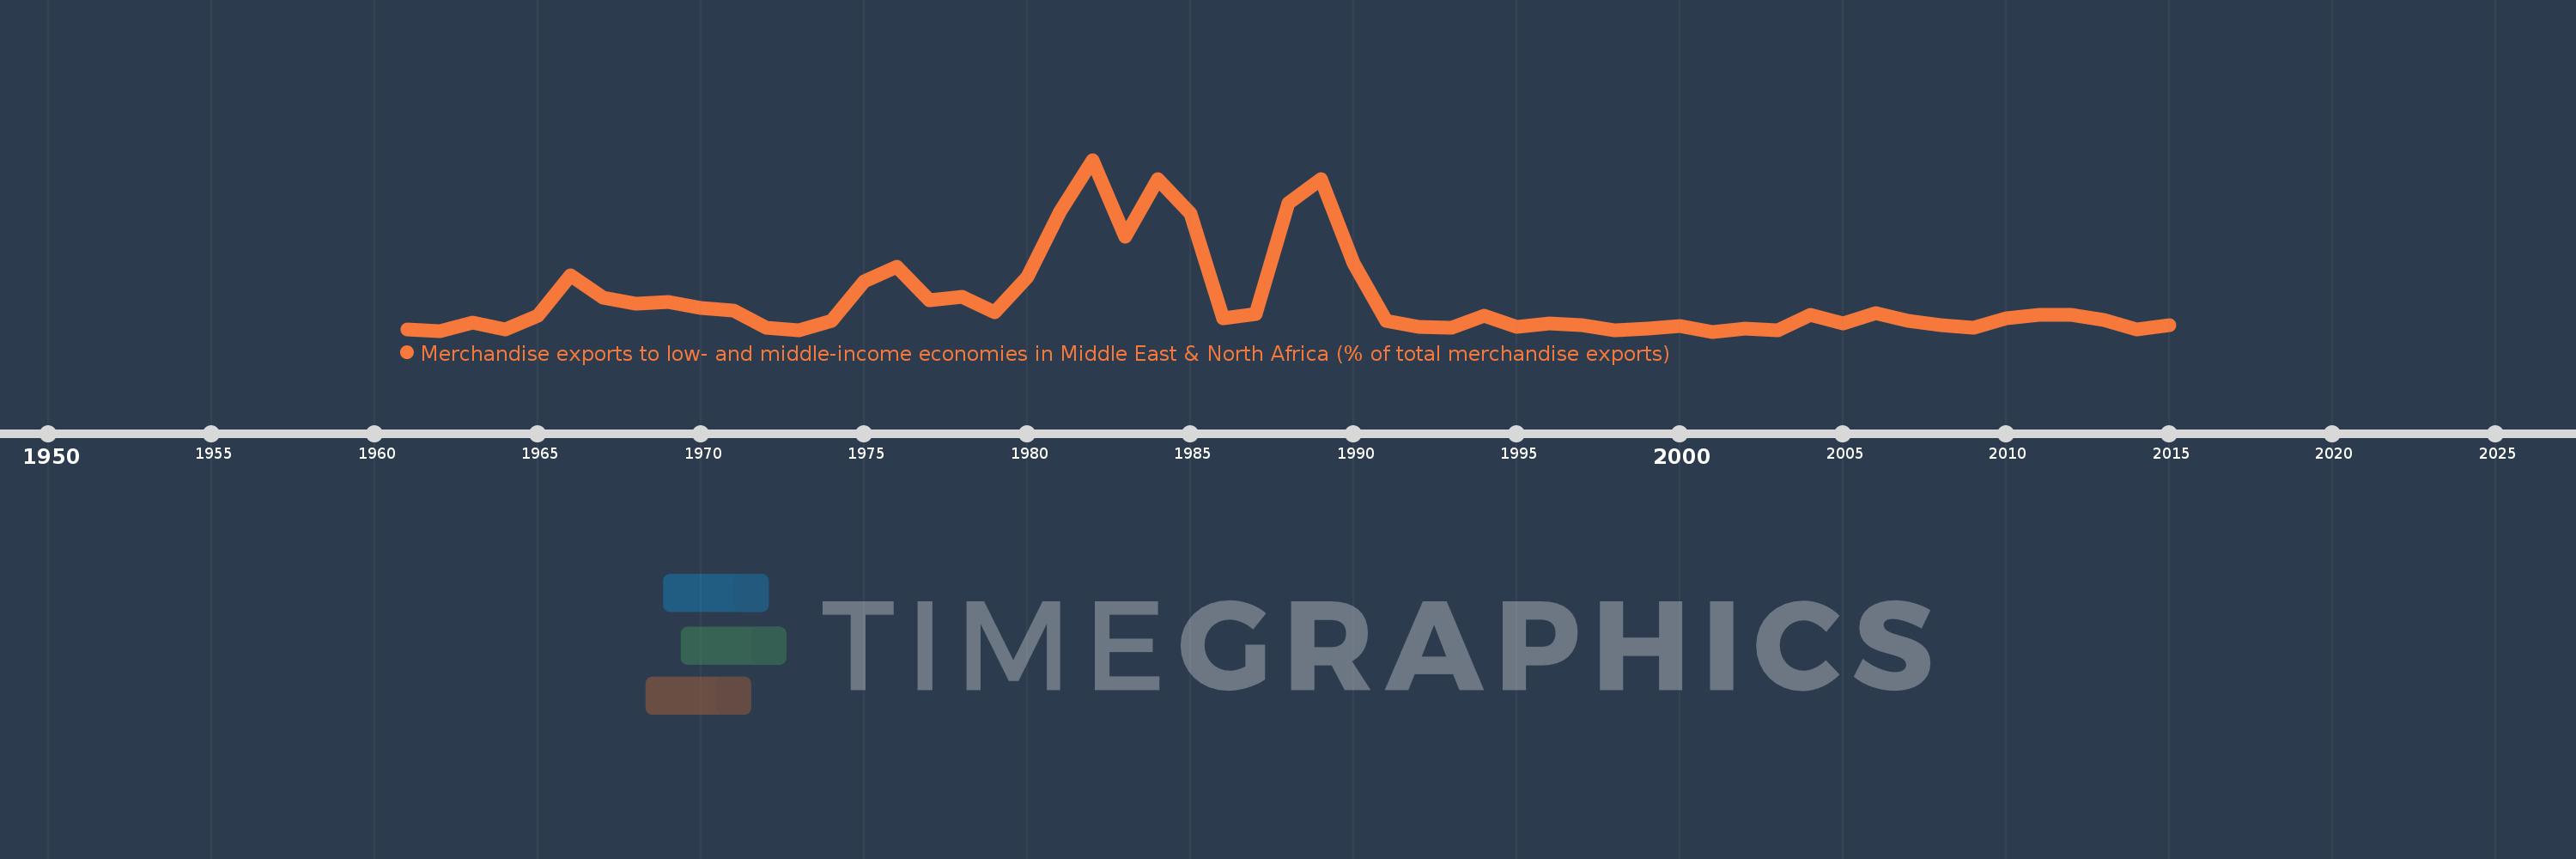
Merchandise exports to low- and middle-income economies in Middle East & North Africa (% of total merchandise exports)
2015,2014,2013,2012,2011,2010,2009,2008,2007,2006,2005,2004,2003,2002,2001,2000,1999,1998,1997,1996,1995,1994,1993,1992,1991,1990,1989,1988,1987,1986,1985,1984,1983,1982,1981,1980,1979,1978,1977,1976,1975,1974,1973,1972,1971,1970,1969,1968,1967,1966,1965,1964,1963,1962,1961
Estas estadísticas en otros países:
AfghanistanAlbaniaAlgeriaAngolaArab WorldArgentinaArmeniaArubaAustraliaAustriaAzerbaijanBahamas, TheBahrainBangladeshBarbadosBelarusBelgiumBelizeBeninBermudaBoliviaBosnia and HerzegovinaBrazilBrunei DarussalamBulgariaBurkina FasoBurundiCabo VerdeCambodiaCameroonCanadaCaribbean small statesCentral African RepublicCentral Europe and the BalticsChadChileChinaColombiaComorosCongo, Dem. Rep.Congo, Rep.Costa RicaCote d'IvoireCroatiaCubaCyprusCzech RepublicDenmarkDjiboutiDominicaDominican RepublicEarly-demographic dividendEast Asia & PacificEast Asia & Pacific (excluding high income)East Asia & Pacific (IDA & IBRD countries)EcuadorEgypt, Arab Rep.El SalvadorEquatorial GuineaEstoniaEthiopiaEuro areaEurope & Central AsiaEurope & Central Asia (excluding high income)Europe & Central Asia (IDA & IBRD countries)European UnionFijiFinlandFragile and conflict affected situationsFranceGabonGambia, TheGeorgiaGermanyGhanaGreeceGreenlandGrenadaGuatemalaGuineaGuinea-BissauGuyanaHaitiHeavily indebted poor countries (HIPC)High incomeHondurasHong Kong SAR, ChinaHungaryIBRD onlyIcelandIDA & IBRD totalIDA blendIDA onlyIDA totalIndiaIndonesiaIran, Islamic Rep.IraqIrelandIsraelItalyJamaicaJapanJordanKazakhstanKenyaKorea, Dem. People’s Rep.Korea, Rep.KosovoKuwaitKyrgyz RepublicLao PDRLate-demographic dividendLatin America & Caribbean Latin America & Caribbean (excluding high income)Latin America & the Caribbean (IDA & IBRD countries)LatviaLeast developed countries: UN classificationLebanonLiberiaLibyaLithuaniaLow & middle incomeLow incomeLower middle incomeLuxembourgMacao SAR, ChinaMacedonia, FYRMadagascarMalawiMalaysiaMaliMaltaMauritaniaMauritiusMexicoMiddle East & North AfricaMiddle East & North Africa (excluding high income)Middle East & North Africa (IDA & IBRD countries)Middle incomeMoldovaMongoliaMontenegroMoroccoMozambiqueMyanmarNepalNetherlandsNew CaledoniaNew ZealandNicaraguaNigerNigeriaNorth AmericaNorwayOECD membersOmanOther small statesPacific island small statesPakistanPanamaPapua New GuineaParaguayPeruPhilippinesPolandPortugalPost-demographic dividendPre-demographic dividendQatarRomaniaRussian FederationRwandaSamoaSaudi ArabiaSenegalSerbiaSeychellesSierra LeoneSingaporeSlovak RepublicSloveniaSmall statesSomaliaSouth AfricaSouth AsiaSouth Asia (IDA & IBRD)SpainSri LankaSt. LuciaSub-Saharan Africa Sub-Saharan Africa (excluding high income)Sub-Saharan Africa (IDA & IBRD countries)SudanSurinameSwedenSwitzerlandSyrian Arab RepublicTajikistanTanzaniaThailandTogoTrinidad and TobagoTunisiaTurkeyTurkmenistanUgandaUkraineUnited Arab EmiratesUnited KingdomUnited StatesUpper middle incomeUruguayUzbekistanVenezuela, RBVietnamWorldYemen, Rep.ZambiaZimbabwe línea de tiempo (timeline):
En esta escala de tiempo se presenta un gráfico de 1961 y 2015 de Tanzania. Los datos de 1960 están ausentes. El número de observaciones reales por fecha: 55.
Fuente (nombre):
Indicadores del desarrollo mundial
Fuente (organización):
World Bank staff estimates based data from International Monetary Fund's Direction of Trade database.
Categorías:
Private Sector, Trade
Se ha actualizado:
23 abr 2017 año
Los indicadores de los cambios de valor en los últimos años
Mínimo:
0.267
1 ene 2001 año
Máximo:
5.643
1 ene 1982 año
A la fecha de observación
Valor
Cambio absoluto
El cambio con respecto al valor anterior
1 ene 1961 año
0.324
+0.324
0.0%
1 ene 1962 año
0.289
-0.035
-10.74%
1 ene 1963 año
0.543
+0.253
87.52%
1 ene 1964 año
0.334
-0.208
-38.41%
1 ene 1965 año
0.759
+0.425
127.1%
1 ene 1966 año
2.034
+1.275
167.93%
1 ene 1967 año
1.317
-0.717
-35.25%
1 ene 1968 año
1.138
-0.179
-13.59%
1 ene 1969 año
1.207
+0.069
6.1%
1 ene 1970 año
1.016
-0.192
-15.88%
1 ene 1971 año
0.921
-0.095
-9.35%
1 ene 1972 año
0.39
-0.531
-57.64%
1 ene 1973 año
0.308
-0.082
-20.97%
1 ene 1974 año
0.61
+0.302
97.89%
1 ene 1975 año
1.831
+1.222
200.33%
1 ene 1976 año
2.299
+0.468
25.55%
1 ene 1977 año
1.251
-1.049
-45.61%
1 ene 1978 año
1.357
+0.107
8.55%
1 ene 1979 año
0.88
-0.478
-35.19%
1 ene 1980 año
1.979
+1.1
124.98%
1 ene 1981 año
4.009
+2.03
102.56%
1 ene 1982 año
5.643
+1.633
40.74%
1 ene 1983 año
3.249
-2.394
-42.42%
1 ene 1984 año
5.041
+1.792
55.14%
1 ene 1985 año
3.976
-1.065
-21.13%
1 ene 1986 año
0.687
-3.289
-82.72%
1 ene 1987 año
0.813
+0.126
18.3%
1 ene 1988 año
4.276
+3.463
425.98%
1 ene 1989 año
5.048
+0.771
18.04%
1 ene 1990 año
2.415
-2.633
-52.16%
1 ene 1991 año
0.613
-1.801
-74.6%
1 ene 1992 año
0.418
-0.195
-31.79%
1 ene 1993 año
0.377
-0.041
-9.83%
1 ene 1994 año
0.775
+0.398
105.4%
1 ene 1995 año
0.425
-0.35
-45.22%
1 ene 1996 año
0.528
+0.103
24.26%
1 ene 1997 año
0.467
-0.061
-11.55%
1 ene 1998 año
0.301
-0.166
-35.49%
1 ene 1999 año
0.354
+0.053
17.72%
1 ene 2000 año
0.436
+0.082
23.12%
1 ene 2001 año
0.267
-0.169
-38.74%
1 ene 2002 año
0.372
+0.105
39.35%
1 ene 2003 año
0.299
-0.074
-19.75%
1 ene 2004 año
0.789
+0.49
163.95%
1 ene 2005 año
0.521
-0.268
-33.99%
1 ene 2006 año
0.845
+0.324
62.31%
1 ene 2007 año
0.599
-0.246
-29.13%
1 ene 2008 año
0.457
-0.142
-23.64%
1 ene 2009 año
0.392
-0.065
-14.2%
1 ene 2010 año
0.683
+0.29
73.98%
1 ene 2011 año
0.798
+0.115
16.84%
1 ene 2012 año
0.78
-0.017
-2.17%
1 ene 2013 año
0.623
-0.157
-20.15%
1 ene 2014 año
0.332
-0.292
-46.8%
1 ene 2015 año
0.459
+0.128
38.54%
Ranking de los países por los datos estadísticos actuales


Comentarios: