29
/es/
es
AIzaSyAYiBZKx7MnpbEhh9jyipgxe19OcubqV5w
April 1, 2024
62427
World
WLD
false
2
1
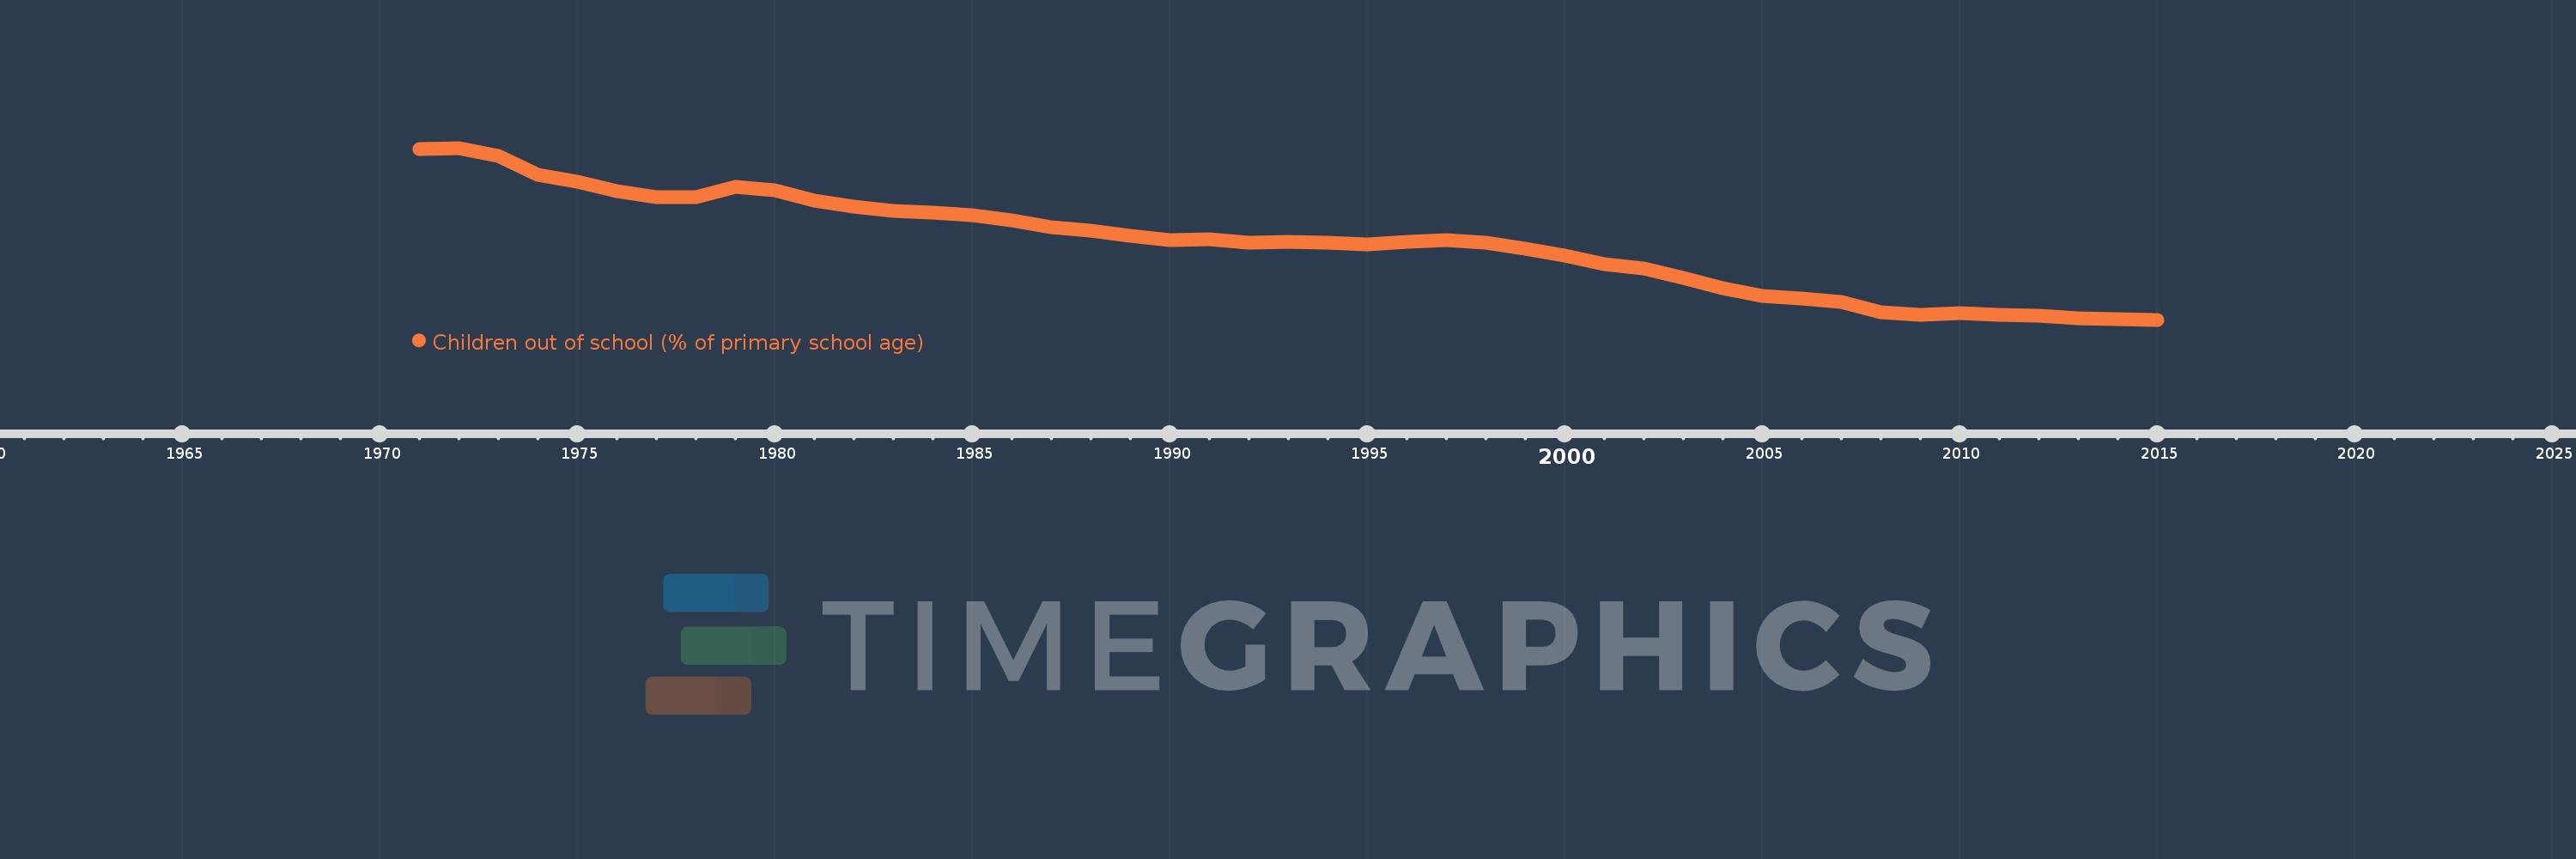
Children out of school (% of primary school age)
2015,2014,2013,2012,2011,2010,2009,2008,2007,2006,2005,2004,2003,2002,2001,2000,1999,1998,1997,1996,1995,1994,1993,1992,1991,1990,1989,1988,1987,1986,1985,1984,1983,1982,1981,1980,1979,1978,1977,1976,1975,1974,1973,1972,1971
Estas estadísticas en otros países:
AfghanistanAlbaniaAlgeriaAngolaAntigua and BarbudaArab WorldArgentinaArmeniaArubaAustraliaAustriaAzerbaijanBahamas, TheBahrainBangladeshBarbadosBelarusBelgiumBelizeBeninBermudaBhutanBoliviaBosnia and HerzegovinaBotswanaBrazilBrunei DarussalamBulgariaBurkina FasoBurundiCabo VerdeCambodiaCameroonCanadaCaribbean small statesCentral African RepublicCentral Europe and the BalticsChadChileChinaColombiaComorosCongo, Dem. Rep.Congo, Rep.Costa RicaCote d'IvoireCroatiaCubaCyprusDenmarkDjiboutiDominicaDominican RepublicEarly-demographic dividendEast Asia & PacificEast Asia & Pacific (excluding high income)East Asia & Pacific (IDA & IBRD countries)EcuadorEgypt, Arab Rep.El SalvadorEquatorial GuineaEritreaEstoniaEthiopiaEuro areaEurope & Central AsiaEurope & Central Asia (excluding high income)Europe & Central Asia (IDA & IBRD countries)European UnionFijiFinlandFragile and conflict affected situationsFranceGabonGambia, TheGeorgiaGermanyGhanaGreeceGrenadaGuatemalaGuineaGuinea-BissauGuyanaHaitiHeavily indebted poor countries (HIPC)High incomeHondurasHong Kong SAR, ChinaHungaryIBRD onlyIcelandIDA & IBRD totalIDA blendIDA onlyIDA totalIndiaIndonesiaIran, Islamic Rep.IraqIrelandIsraelItalyJamaicaJapanJordanKazakhstanKenyaKiribatiKorea, Dem. People’s Rep.Korea, Rep.KuwaitKyrgyz RepublicLao PDRLate-demographic dividendLatin America & Caribbean Latin America & Caribbean (excluding high income)Latin America & the Caribbean (IDA & IBRD countries)LatviaLeast developed countries: UN classificationLebanonLesothoLiberiaLibyaLiechtensteinLithuaniaLow & middle incomeLow incomeLower middle incomeLuxembourgMacao SAR, ChinaMacedonia, FYRMadagascarMalawiMalaysiaMaldivesMaliMaltaMarshall IslandsMauritaniaMauritiusMexicoMicronesia, Fed. Sts.Middle East & North AfricaMiddle East & North Africa (excluding high income)Middle East & North Africa (IDA & IBRD countries)Middle incomeMoldovaMongoliaMontenegroMoroccoMozambiqueMyanmarNamibiaNauruNepalNetherlandsNew ZealandNicaraguaNigerNigeriaNorth AmericaNorwayOECD membersOmanOther small statesPacific island small statesPakistanPalauPanamaPapua New GuineaParaguayPeruPhilippinesPolandPortugalPost-demographic dividendPre-demographic dividendPuerto RicoQatarRomaniaRussian FederationRwandaSamoaSan MarinoSao Tome and PrincipeSaudi ArabiaSenegalSerbiaSeychellesSierra LeoneSloveniaSmall statesSolomon IslandsSomaliaSouth AfricaSouth AsiaSouth Asia (IDA & IBRD)South SudanSpainSri LankaSt. Kitts and NevisSt. LuciaSt. Vincent and the GrenadinesSub-Saharan Africa Sub-Saharan Africa (excluding high income)Sub-Saharan Africa (IDA & IBRD countries)SudanSurinameSwazilandSwedenSwitzerlandSyrian Arab RepublicTajikistanTanzaniaThailandTimor-LesteTogoTongaTrinidad and TobagoTunisiaTurkeyTuvaluUgandaUkraineUnited Arab EmiratesUnited KingdomUnited StatesUpper middle incomeUruguayUzbekistanVanuatuVenezuela, RBVietnamWest Bank and GazaWorldYemen, Rep.ZambiaZimbabwe línea de tiempo (timeline):
En esta escala de tiempo se presenta un gráfico de 1971 y 2015 de World. Los datos de 1970 están ausentes. El número de observaciones reales por fecha: 45.
Fuente (nombre):
Indicadores del desarrollo mundial
Fuente (organización):
United Nations Educational, Scientific, and Cultural Organization (UNESCO) Institute for Statistics.
Categorías:
Education
Se ha actualizado:
23 abr 2017 año
Los indicadores de los cambios de valor en los últimos años
Mínimo:
8.864
1 ene 2015 año
Máximo:
27.742
1 ene 1972 año
A la fecha de observación
Valor
Cambio absoluto
El cambio con respecto al valor anterior
1 ene 1971 año
27.647
+27.647
0.0%
1 ene 1972 año
27.742
+0.095
0.34%
1 ene 1973 año
26.87
-0.872
-3.14%
1 ene 1974 año
24.742
-2.128
-7.92%
1 ene 1975 año
24.073
-0.668
-2.7%
1 ene 1976 año
22.947
-1.126
-4.68%
1 ene 1977 año
22.329
-0.618
-2.69%
1 ene 1978 año
22.358
+0.029
0.13%
1 ene 1979 año
23.433
+1.075
4.81%
1 ene 1980 año
23.117
-0.316
-1.35%
1 ene 1981 año
21.991
-1.126
-4.87%
1 ene 1982 año
21.261
-0.731
-3.32%
1 ene 1983 año
20.829
-0.432
-2.03%
1 ene 1984 año
20.59
-0.239
-1.15%
1 ene 1985 año
20.348
-0.241
-1.17%
1 ene 1986 año
19.754
-0.595
-2.92%
1 ene 1987 año
18.987
-0.767
-3.88%
1 ene 1988 año
18.681
-0.305
-1.61%
1 ene 1989 año
18.055
-0.627
-3.35%
1 ene 1990 año
17.622
-0.433
-2.4%
1 ene 1991 año
17.682
+0.06
0.34%
1 ene 1992 año
17.362
-0.32
-1.81%
1 ene 1993 año
17.409
+0.047
0.27%
1 ene 1994 año
17.284
-0.125
-0.72%
1 ene 1995 año
17.171
-0.113
-0.65%
1 ene 1996 año
17.417
+0.246
1.43%
1 ene 1997 año
17.603
+0.185
1.06%
1 ene 1998 año
17.301
-0.302
-1.71%
1 ene 1999 año
16.678
-0.623
-3.6%
1 ene 2000 año
15.885
-0.793
-4.75%
1 ene 2001 año
14.999
-0.886
-5.58%
1 ene 2002 año
14.519
-0.48
-3.2%
1 ene 2003 año
13.506
-1.013
-6.98%
1 ene 2004 año
12.343
-1.163
-8.61%
1 ene 2005 año
11.48
-0.863
-6.99%
1 ene 2006 año
11.237
-0.243
-2.12%
1 ene 2007 año
10.817
-0.421
-3.74%
1 ene 2008 año
9.659
-1.158
-10.7%
1 ene 2009 año
9.44
-0.219
-2.26%
1 ene 2010 año
9.589
+0.149
1.58%
1 ene 2011 año
9.405
-0.185
-1.93%
1 ene 2012 año
9.301
-0.103
-1.1%
1 ene 2013 año
8.986
-0.315
-3.39%
1 ene 2014 año
8.977
-0.009
-0.1%
1 ene 2015 año
8.864
-0.113
-1.25%
Ranking de los países por los datos estadísticos actuales


Comentarios: