29
/es/
es
AIzaSyAYiBZKx7MnpbEhh9jyipgxe19OcubqV5w
April 1, 2024
55361
Pre-demographic dividend
PRE
false
2
1
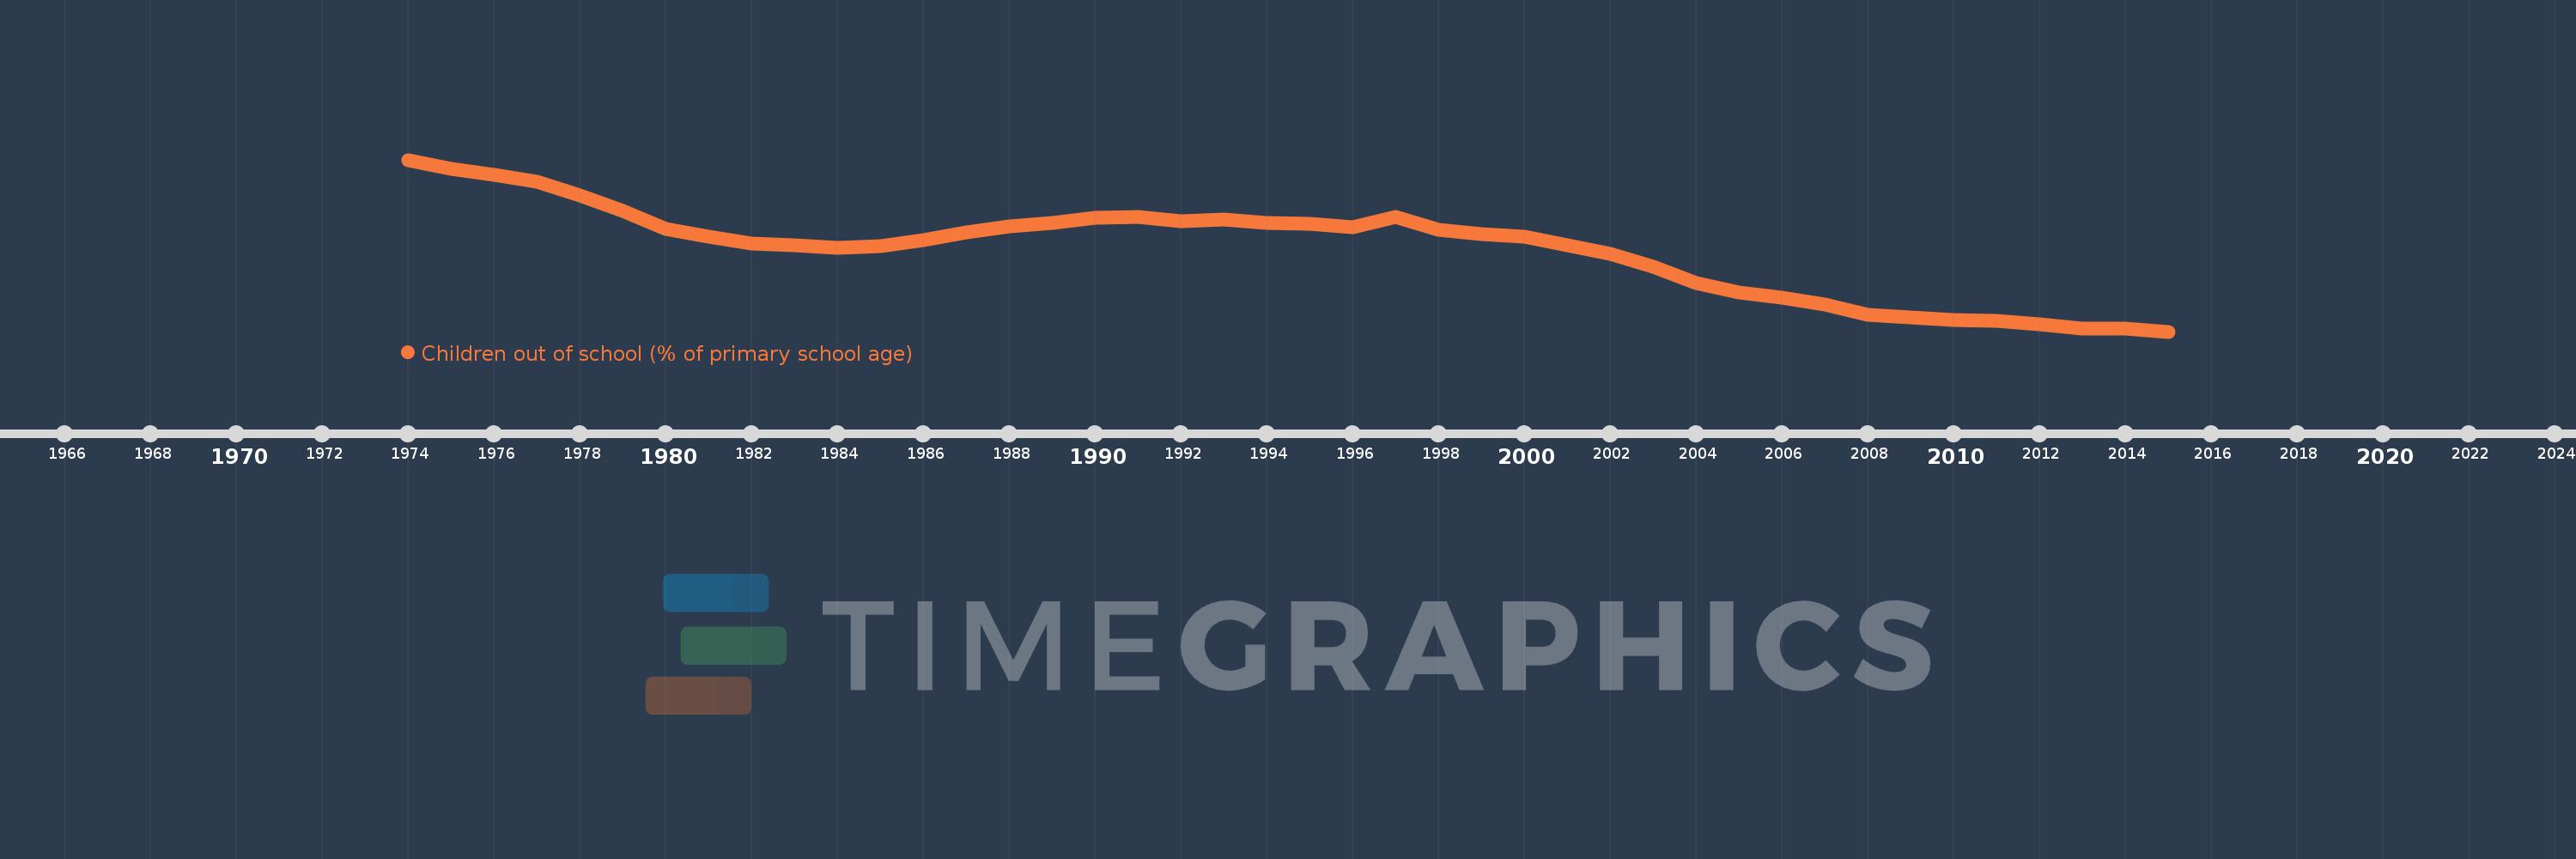
Children out of school (% of primary school age)
2015,2014,2013,2012,2011,2010,2009,2008,2007,2006,2005,2004,2003,2002,2001,2000,1999,1998,1997,1996,1995,1994,1993,1992,1991,1990,1989,1988,1987,1986,1985,1984,1983,1982,1981,1980,1979,1978,1977,1976,1975,1974
Estas estadísticas en otros países:
AfghanistanAlbaniaAlgeriaAngolaAntigua and BarbudaArab WorldArgentinaArmeniaArubaAustraliaAustriaAzerbaijanBahamas, TheBahrainBangladeshBarbadosBelarusBelgiumBelizeBeninBermudaBhutanBoliviaBosnia and HerzegovinaBotswanaBrazilBrunei DarussalamBulgariaBurkina FasoBurundiCabo VerdeCambodiaCameroonCanadaCaribbean small statesCentral African RepublicCentral Europe and the BalticsChadChileChinaColombiaComorosCongo, Dem. Rep.Congo, Rep.Costa RicaCote d'IvoireCroatiaCubaCyprusDenmarkDjiboutiDominicaDominican RepublicEarly-demographic dividendEast Asia & PacificEast Asia & Pacific (excluding high income)East Asia & Pacific (IDA & IBRD countries)EcuadorEgypt, Arab Rep.El SalvadorEquatorial GuineaEritreaEstoniaEthiopiaEuro areaEurope & Central AsiaEurope & Central Asia (excluding high income)Europe & Central Asia (IDA & IBRD countries)European UnionFijiFinlandFragile and conflict affected situationsFranceGabonGambia, TheGeorgiaGermanyGhanaGreeceGrenadaGuatemalaGuineaGuinea-BissauGuyanaHaitiHeavily indebted poor countries (HIPC)High incomeHondurasHong Kong SAR, ChinaHungaryIBRD onlyIcelandIDA & IBRD totalIDA blendIDA onlyIDA totalIndiaIndonesiaIran, Islamic Rep.IraqIrelandIsraelItalyJamaicaJapanJordanKazakhstanKenyaKiribatiKorea, Dem. People’s Rep.Korea, Rep.KuwaitKyrgyz RepublicLao PDRLate-demographic dividendLatin America & Caribbean Latin America & Caribbean (excluding high income)Latin America & the Caribbean (IDA & IBRD countries)LatviaLeast developed countries: UN classificationLebanonLesothoLiberiaLibyaLiechtensteinLithuaniaLow & middle incomeLow incomeLower middle incomeLuxembourgMacao SAR, ChinaMacedonia, FYRMadagascarMalawiMalaysiaMaldivesMaliMaltaMarshall IslandsMauritaniaMauritiusMexicoMicronesia, Fed. Sts.Middle East & North AfricaMiddle East & North Africa (excluding high income)Middle East & North Africa (IDA & IBRD countries)Middle incomeMoldovaMongoliaMontenegroMoroccoMozambiqueMyanmarNamibiaNauruNepalNetherlandsNew ZealandNicaraguaNigerNigeriaNorth AmericaNorwayOECD membersOmanOther small statesPacific island small statesPakistanPalauPanamaPapua New GuineaParaguayPeruPhilippinesPolandPortugalPost-demographic dividendPre-demographic dividendPuerto RicoQatarRomaniaRussian FederationRwandaSamoaSan MarinoSao Tome and PrincipeSaudi ArabiaSenegalSerbiaSeychellesSierra LeoneSloveniaSmall statesSolomon IslandsSomaliaSouth AfricaSouth AsiaSouth Asia (IDA & IBRD)South SudanSpainSri LankaSt. Kitts and NevisSt. LuciaSt. Vincent and the GrenadinesSub-Saharan Africa Sub-Saharan Africa (excluding high income)Sub-Saharan Africa (IDA & IBRD countries)SudanSurinameSwazilandSwedenSwitzerlandSyrian Arab RepublicTajikistanTanzaniaThailandTimor-LesteTogoTongaTrinidad and TobagoTunisiaTurkeyTuvaluUgandaUkraineUnited Arab EmiratesUnited KingdomUnited StatesUpper middle incomeUruguayUzbekistanVanuatuVenezuela, RBVietnamWest Bank and GazaWorldYemen, Rep.ZambiaZimbabwe línea de tiempo (timeline):
En esta escala de tiempo se presenta un gráfico de 1974 y 2015 de Pre-demographic dividend. Los datos de 1973 están ausentes. El número de observaciones reales por fecha: 42.
Fuente (nombre):
Indicadores del desarrollo mundial
Fuente (organización):
United Nations Educational, Scientific, and Cultural Organization (UNESCO) Institute for Statistics.
Categorías:
Education
Se ha actualizado:
23 abr 2017 año
Los indicadores de los cambios de valor en los últimos años
Mínimo:
23.512
1 ene 2015 año
Máximo:
60.308
1 ene 1974 año
A la fecha de observación
Valor
Cambio absoluto
El cambio con respecto al valor anterior
1 ene 1974 año
60.308
+60.308
0.0%
1 ene 1975 año
58.456
-1.852
-3.07%
1 ene 1976 año
57.024
-1.432
-2.45%
1 ene 1977 año
55.543
-1.481
-2.6%
1 ene 1978 año
52.748
-2.794
-5.03%
1 ene 1979 año
49.335
-3.413
-6.47%
1 ene 1980 año
45.508
-3.828
-7.76%
1 ene 1981 año
43.791
-1.717
-3.77%
1 ene 1982 año
42.457
-1.334
-3.05%
1 ene 1983 año
42.037
-0.42
-0.99%
1 ene 1984 año
41.52
-0.517
-1.23%
1 ene 1985 año
41.833
+0.314
0.76%
1 ene 1986 año
43.016
+1.183
2.83%
1 ene 1987 año
44.687
+1.671
3.88%
1 ene 1988 año
46.012
+1.325
2.97%
1 ene 1989 año
46.722
+0.71
1.54%
1 ene 1990 año
47.858
+1.137
2.43%
1 ene 1991 año
48.022
+0.163
0.34%
1 ene 1992 año
47.079
-0.943
-1.96%
1 ene 1993 año
47.57
+0.491
1.04%
1 ene 1994 año
46.854
-0.716
-1.5%
1 ene 1995 año
46.594
-0.26
-0.56%
1 ene 1996 año
45.918
-0.675
-1.45%
1 ene 1997 año
47.999
+2.081
4.53%
1 ene 1998 año
45.239
-2.76
-5.75%
1 ene 1999 año
44.366
-0.873
-1.93%
1 ene 2000 año
43.769
-0.597
-1.34%
1 ene 2001 año
41.95
-1.819
-4.16%
1 ene 2002 año
40.104
-1.846
-4.4%
1 ene 2003 año
37.385
-2.719
-6.78%
1 ene 2004 año
33.982
-3.403
-9.1%
1 ene 2005 año
31.933
-2.05
-6.03%
1 ene 2006 año
30.837
-1.096
-3.43%
1 ene 2007 año
29.24
-1.596
-5.18%
1 ene 2008 año
27.047
-2.193
-7.5%
1 ene 2009 año
26.586
-0.461
-1.71%
1 ene 2010 año
26.073
-0.512
-1.93%
1 ene 2011 año
25.872
-0.201
-0.77%
1 ene 2012 año
25.112
-0.76
-2.94%
1 ene 2013 año
24.123
-0.988
-3.93%
1 ene 2014 año
24.067
-0.057
-0.24%
1 ene 2015 año
23.512
-0.555
-2.31%
Ranking de los países por los datos estadísticos actuales


Comentarios: