29
/es/
es
AIzaSyAYiBZKx7MnpbEhh9jyipgxe19OcubqV5w
April 1, 2024
171492
Kuwait
KWT
true
2
1
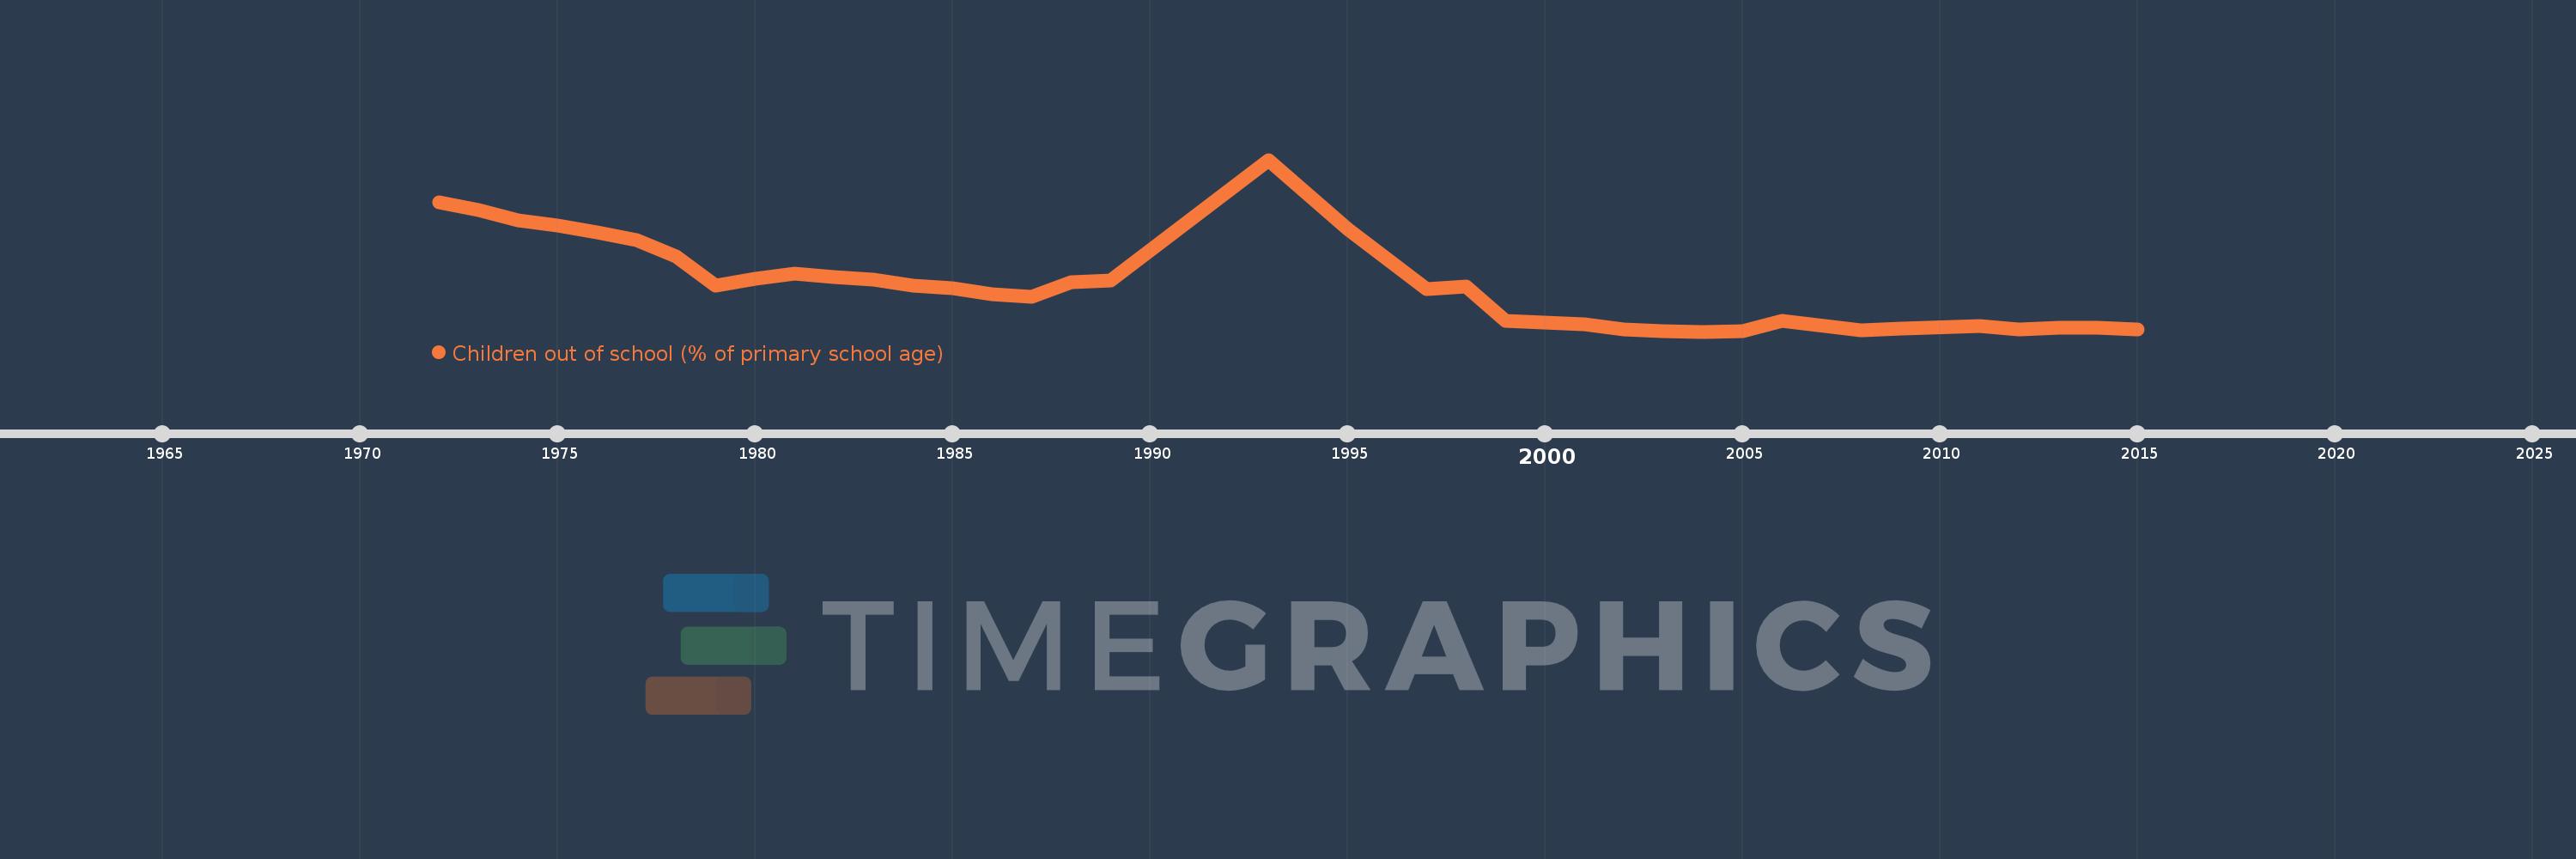
Children out of school (% of primary school age)
2015,2014,2013,2012,2011,2009,2008,2006,2005,2004,2003,2002,2001,2000,1999,1998,1997,1995,1993,1989,1988,1987,1986,1985,1984,1983,1982,1981,1980,1979,1978,1977,1976,1975,1974,1973,1972
Estas estadísticas en otros países:
AfghanistanAlbaniaAlgeriaAngolaAntigua and BarbudaArab WorldArgentinaArmeniaArubaAustraliaAustriaAzerbaijanBahamas, TheBahrainBangladeshBarbadosBelarusBelgiumBelizeBeninBermudaBhutanBoliviaBosnia and HerzegovinaBotswanaBrazilBrunei DarussalamBulgariaBurkina FasoBurundiCabo VerdeCambodiaCameroonCanadaCaribbean small statesCentral African RepublicCentral Europe and the BalticsChadChileChinaColombiaComorosCongo, Dem. Rep.Congo, Rep.Costa RicaCote d'IvoireCroatiaCubaCyprusDenmarkDjiboutiDominicaDominican RepublicEarly-demographic dividendEast Asia & PacificEast Asia & Pacific (excluding high income)East Asia & Pacific (IDA & IBRD countries)EcuadorEgypt, Arab Rep.El SalvadorEquatorial GuineaEritreaEstoniaEthiopiaEuro areaEurope & Central AsiaEurope & Central Asia (excluding high income)Europe & Central Asia (IDA & IBRD countries)European UnionFijiFinlandFragile and conflict affected situationsFranceGabonGambia, TheGeorgiaGermanyGhanaGreeceGrenadaGuatemalaGuineaGuinea-BissauGuyanaHaitiHeavily indebted poor countries (HIPC)High incomeHondurasHong Kong SAR, ChinaHungaryIBRD onlyIcelandIDA & IBRD totalIDA blendIDA onlyIDA totalIndiaIndonesiaIran, Islamic Rep.IraqIrelandIsraelItalyJamaicaJapanJordanKazakhstanKenyaKiribatiKorea, Dem. People’s Rep.Korea, Rep.KuwaitKyrgyz RepublicLao PDRLate-demographic dividendLatin America & Caribbean Latin America & Caribbean (excluding high income)Latin America & the Caribbean (IDA & IBRD countries)LatviaLeast developed countries: UN classificationLebanonLesothoLiberiaLibyaLiechtensteinLithuaniaLow & middle incomeLow incomeLower middle incomeLuxembourgMacao SAR, ChinaMacedonia, FYRMadagascarMalawiMalaysiaMaldivesMaliMaltaMarshall IslandsMauritaniaMauritiusMexicoMicronesia, Fed. Sts.Middle East & North AfricaMiddle East & North Africa (excluding high income)Middle East & North Africa (IDA & IBRD countries)Middle incomeMoldovaMongoliaMontenegroMoroccoMozambiqueMyanmarNamibiaNauruNepalNetherlandsNew ZealandNicaraguaNigerNigeriaNorth AmericaNorwayOECD membersOmanOther small statesPacific island small statesPakistanPalauPanamaPapua New GuineaParaguayPeruPhilippinesPolandPortugalPost-demographic dividendPre-demographic dividendPuerto RicoQatarRomaniaRussian FederationRwandaSamoaSan MarinoSao Tome and PrincipeSaudi ArabiaSenegalSerbiaSeychellesSierra LeoneSloveniaSmall statesSolomon IslandsSomaliaSouth AfricaSouth AsiaSouth Asia (IDA & IBRD)South SudanSpainSri LankaSt. Kitts and NevisSt. LuciaSt. Vincent and the GrenadinesSub-Saharan Africa Sub-Saharan Africa (excluding high income)Sub-Saharan Africa (IDA & IBRD countries)SudanSurinameSwazilandSwedenSwitzerlandSyrian Arab RepublicTajikistanTanzaniaThailandTimor-LesteTogoTongaTrinidad and TobagoTunisiaTurkeyTuvaluUgandaUkraineUnited Arab EmiratesUnited KingdomUnited StatesUpper middle incomeUruguayUzbekistanVanuatuVenezuela, RBVietnamWest Bank and GazaWorldYemen, Rep.ZambiaZimbabwe línea de tiempo (timeline):
En esta escala de tiempo se presenta un gráfico de 1972 y 2015 de Kuwait. Los datos de 1971 están ausentes. El número de observaciones reales por fecha: 37.
Fuente (nombre):
Indicadores del desarrollo mundial
Fuente (organización):
United Nations Educational, Scientific, and Cultural Organization (UNESCO) Institute for Statistics.
Categorías:
Education
Se ha actualizado:
23 abr 2017 año
Los indicadores de los cambios de valor en los últimos años
Mínimo:
0.763
1 ene 2004 año
Máximo:
52.018
1 ene 1993 año
A la fecha de observación
Valor
Cambio absoluto
El cambio con respecto al valor anterior
1 ene 1972 año
39.292
+39.292
0.0%
1 ene 1973 año
37.012
-2.28
-5.8%
1 ene 1974 año
33.841
-3.171
-8.57%
1 ene 1975 año
32.338
-1.503
-4.44%
1 ene 1976 año
30.384
-1.954
-6.04%
1 ene 1977 año
28.03
-2.354
-7.75%
1 ene 1978 año
23.224
-4.806
-17.15%
1 ene 1979 año
14.517
-8.707
-37.49%
1 ene 1980 año
16.47
+1.953
13.45%
1 ene 1981 año
18.119
+1.649
10.01%
1 ene 1982 año
17.022
-1.097
-6.06%
1 ene 1983 año
16.274
-0.748
-4.39%
1 ene 1984 año
14.37
-1.903
-11.7%
1 ene 1985 año
13.599
-0.771
-5.37%
1 ene 1986 año
12.0
-1.599
-11.76%
1 ene 1987 año
11.137
-0.863
-7.19%
1 ene 1988 año
15.414
+4.277
38.4%
1 ene 1989 año
16.002
+0.588
3.81%
1 ene 1993 año
52.018
+36.016
225.08%
1 ene 1995 año
31.484
-20.534
-39.47%
1 ene 1997 año
13.559
-17.925
-56.93%
1 ene 1998 año
14.277
+0.718
5.29%
1 ene 1999 año
4.048
-10.229
-71.64%
1 ene 2000 año
3.371
-0.677
-16.73%
1 ene 2001 año
2.949
-0.422
-12.53%
1 ene 2002 año
1.34
-1.609
-54.55%
1 ene 2003 año
0.98
-0.36
-26.84%
1 ene 2004 año
0.763
-0.218
-22.23%
1 ene 2005 año
0.827
+0.064
8.41%
1 ene 2006 año
3.91
+3.084
373.05%
1 ene 2008 año
1.232
-2.678
-68.48%
1 ene 2009 año
1.687
+0.454
36.87%
1 ene 2011 año
2.514
+0.828
49.06%
1 ene 2012 año
1.524
-0.99
-39.38%
1 ene 2013 año
1.974
+0.45
29.53%
1 ene 2014 año
1.907
-0.067
-3.41%
1 ene 2015 año
1.297
-0.61
-31.99%
Ranking de los países por los datos estadísticos actuales


Comentarios: