29
/es/
es
AIzaSyAYiBZKx7MnpbEhh9jyipgxe19OcubqV5w
April 1, 2024
247337
Spain
ESP
true
2
1
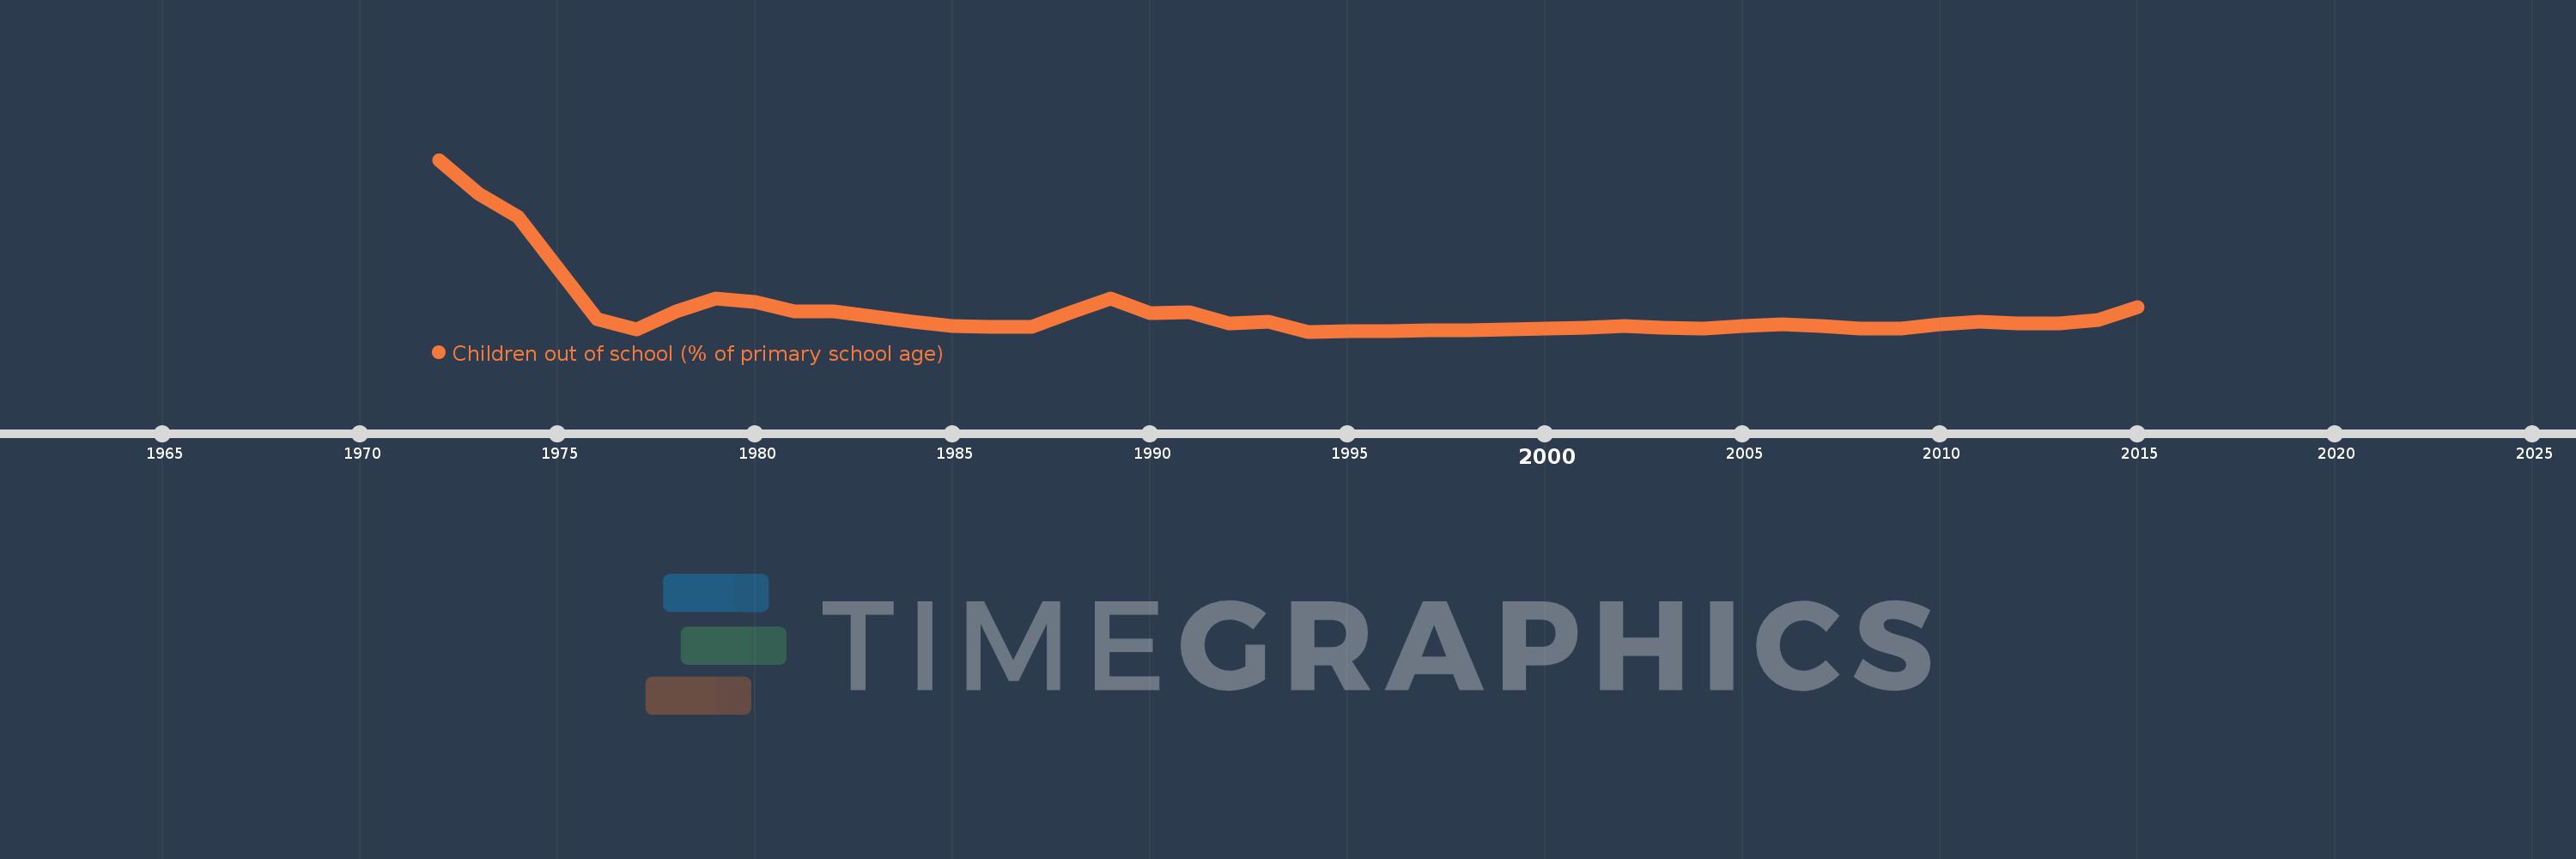
Children out of school (% of primary school age)
2015,2014,2013,2012,2011,2010,2009,2008,2007,2006,2005,2004,2003,2002,2001,2000,1998,1997,1996,1995,1994,1993,1992,1991,1990,1989,1988,1987,1986,1985,1984,1982,1981,1980,1979,1978,1977,1976,1974,1973,1972
Estas estadísticas en otros países:
AfghanistanAlbaniaAlgeriaAngolaAntigua and BarbudaArab WorldArgentinaArmeniaArubaAustraliaAustriaAzerbaijanBahamas, TheBahrainBangladeshBarbadosBelarusBelgiumBelizeBeninBermudaBhutanBoliviaBosnia and HerzegovinaBotswanaBrazilBrunei DarussalamBulgariaBurkina FasoBurundiCabo VerdeCambodiaCameroonCanadaCaribbean small statesCentral African RepublicCentral Europe and the BalticsChadChileChinaColombiaComorosCongo, Dem. Rep.Congo, Rep.Costa RicaCote d'IvoireCroatiaCubaCyprusDenmarkDjiboutiDominicaDominican RepublicEarly-demographic dividendEast Asia & PacificEast Asia & Pacific (excluding high income)East Asia & Pacific (IDA & IBRD countries)EcuadorEgypt, Arab Rep.El SalvadorEquatorial GuineaEritreaEstoniaEthiopiaEuro areaEurope & Central AsiaEurope & Central Asia (excluding high income)Europe & Central Asia (IDA & IBRD countries)European UnionFijiFinlandFragile and conflict affected situationsFranceGabonGambia, TheGeorgiaGermanyGhanaGreeceGrenadaGuatemalaGuineaGuinea-BissauGuyanaHaitiHeavily indebted poor countries (HIPC)High incomeHondurasHong Kong SAR, ChinaHungaryIBRD onlyIcelandIDA & IBRD totalIDA blendIDA onlyIDA totalIndiaIndonesiaIran, Islamic Rep.IraqIrelandIsraelItalyJamaicaJapanJordanKazakhstanKenyaKiribatiKorea, Dem. People’s Rep.Korea, Rep.KuwaitKyrgyz RepublicLao PDRLate-demographic dividendLatin America & Caribbean Latin America & Caribbean (excluding high income)Latin America & the Caribbean (IDA & IBRD countries)LatviaLeast developed countries: UN classificationLebanonLesothoLiberiaLibyaLiechtensteinLithuaniaLow & middle incomeLow incomeLower middle incomeLuxembourgMacao SAR, ChinaMacedonia, FYRMadagascarMalawiMalaysiaMaldivesMaliMaltaMarshall IslandsMauritaniaMauritiusMexicoMicronesia, Fed. Sts.Middle East & North AfricaMiddle East & North Africa (excluding high income)Middle East & North Africa (IDA & IBRD countries)Middle incomeMoldovaMongoliaMontenegroMoroccoMozambiqueMyanmarNamibiaNauruNepalNetherlandsNew ZealandNicaraguaNigerNigeriaNorth AmericaNorwayOECD membersOmanOther small statesPacific island small statesPakistanPalauPanamaPapua New GuineaParaguayPeruPhilippinesPolandPortugalPost-demographic dividendPre-demographic dividendPuerto RicoQatarRomaniaRussian FederationRwandaSamoaSan MarinoSao Tome and PrincipeSaudi ArabiaSenegalSerbiaSeychellesSierra LeoneSloveniaSmall statesSolomon IslandsSomaliaSouth AfricaSouth AsiaSouth Asia (IDA & IBRD)South SudanSpainSri LankaSt. Kitts and NevisSt. LuciaSt. Vincent and the GrenadinesSub-Saharan Africa Sub-Saharan Africa (excluding high income)Sub-Saharan Africa (IDA & IBRD countries)SudanSurinameSwazilandSwedenSwitzerlandSyrian Arab RepublicTajikistanTanzaniaThailandTimor-LesteTogoTongaTrinidad and TobagoTunisiaTurkeyTuvaluUgandaUkraineUnited Arab EmiratesUnited KingdomUnited StatesUpper middle incomeUruguayUzbekistanVanuatuVenezuela, RBVietnamWest Bank and GazaWorldYemen, Rep.ZambiaZimbabwe línea de tiempo (timeline):
En esta escala de tiempo se presenta un gráfico de 1972 y 2015 de Spain. Los datos de 1971 están ausentes. El número de observaciones reales por fecha: 41.
Fuente (nombre):
Indicadores del desarrollo mundial
Fuente (organización):
United Nations Educational, Scientific, and Cultural Organization (UNESCO) Institute for Statistics.
Categorías:
Education
Se ha actualizado:
23 abr 2017 año
Los indicadores de los cambios de valor en los últimos años
Mínimo:
0.008
1 ene 1994 año
Máximo:
6.943
1 ene 1972 año
A la fecha de observación
Valor
Cambio absoluto
El cambio con respecto al valor anterior
1 ene 1972 año
6.943
+6.943
0.0%
1 ene 1973 año
5.582
-1.36
-19.59%
1 ene 1974 año
4.625
-0.957
-17.14%
1 ene 1976 año
0.523
-4.103
-88.69%
1 ene 1977 año
0.084
-0.439
-83.94%
1 ene 1978 año
0.833
+0.749
891.65%
1 ene 1979 año
1.33
+0.497
59.68%
1 ene 1980 año
1.216
-0.114
-8.54%
1 ene 1981 año
0.836
-0.38
-31.27%
1 ene 1982 año
0.811
-0.025
-3.02%
1 ene 1984 año
0.404
-0.407
-50.22%
1 ene 1985 año
0.235
-0.169
-41.84%
1 ene 1986 año
0.202
-0.033
-13.91%
1 ene 1987 año
0.193
-0.009
-4.58%
1 ene 1988 año
0.786
+0.593
307.72%
1 ene 1989 año
1.349
+0.562
71.52%
1 ene 1990 año
0.745
-0.604
-44.79%
1 ene 1991 año
0.774
+0.029
3.94%
1 ene 1992 año
0.335
-0.439
-56.68%
1 ene 1993 año
0.398
+0.063
18.71%
1 ene 1994 año
0.008
-0.39
-97.87%
1 ene 1995 año
0.021
+0.013
152.72%
1 ene 1996 año
0.039
+0.018
84.57%
1 ene 1997 año
0.06
+0.02
51.32%
1 ene 1998 año
0.053
-0.007
-11.91%
1 ene 2000 año
0.131
+0.079
149.43%
1 ene 2001 año
0.178
+0.047
36.0%
1 ene 2002 año
0.232
+0.053
29.77%
1 ene 2003 año
0.172
-0.06
-25.83%
1 ene 2004 año
0.134
-0.038
-22.15%
1 ene 2005 año
0.246
+0.112
83.76%
1 ene 2006 año
0.308
+0.062
25.19%
1 ene 2007 año
0.226
-0.082
-26.61%
1 ene 2008 año
0.122
-0.103
-45.76%
1 ene 2009 año
0.144
+0.022
17.97%
1 ene 2010 año
0.288
+0.144
99.34%
1 ene 2011 año
0.392
+0.104
36.03%
1 ene 2012 año
0.323
-0.069
-17.55%
1 ene 2013 año
0.325
+0.002
0.74%
1 ene 2014 año
0.487
+0.161
49.55%
1 ene 2015 año
1.013
+0.526
108.12%
Ranking de los países por los datos estadísticos actuales


Comentarios: