29
/es/
es
AIzaSyAYiBZKx7MnpbEhh9jyipgxe19OcubqV5w
April 1, 2024
257098
Switzerland
CHE
true
2
1
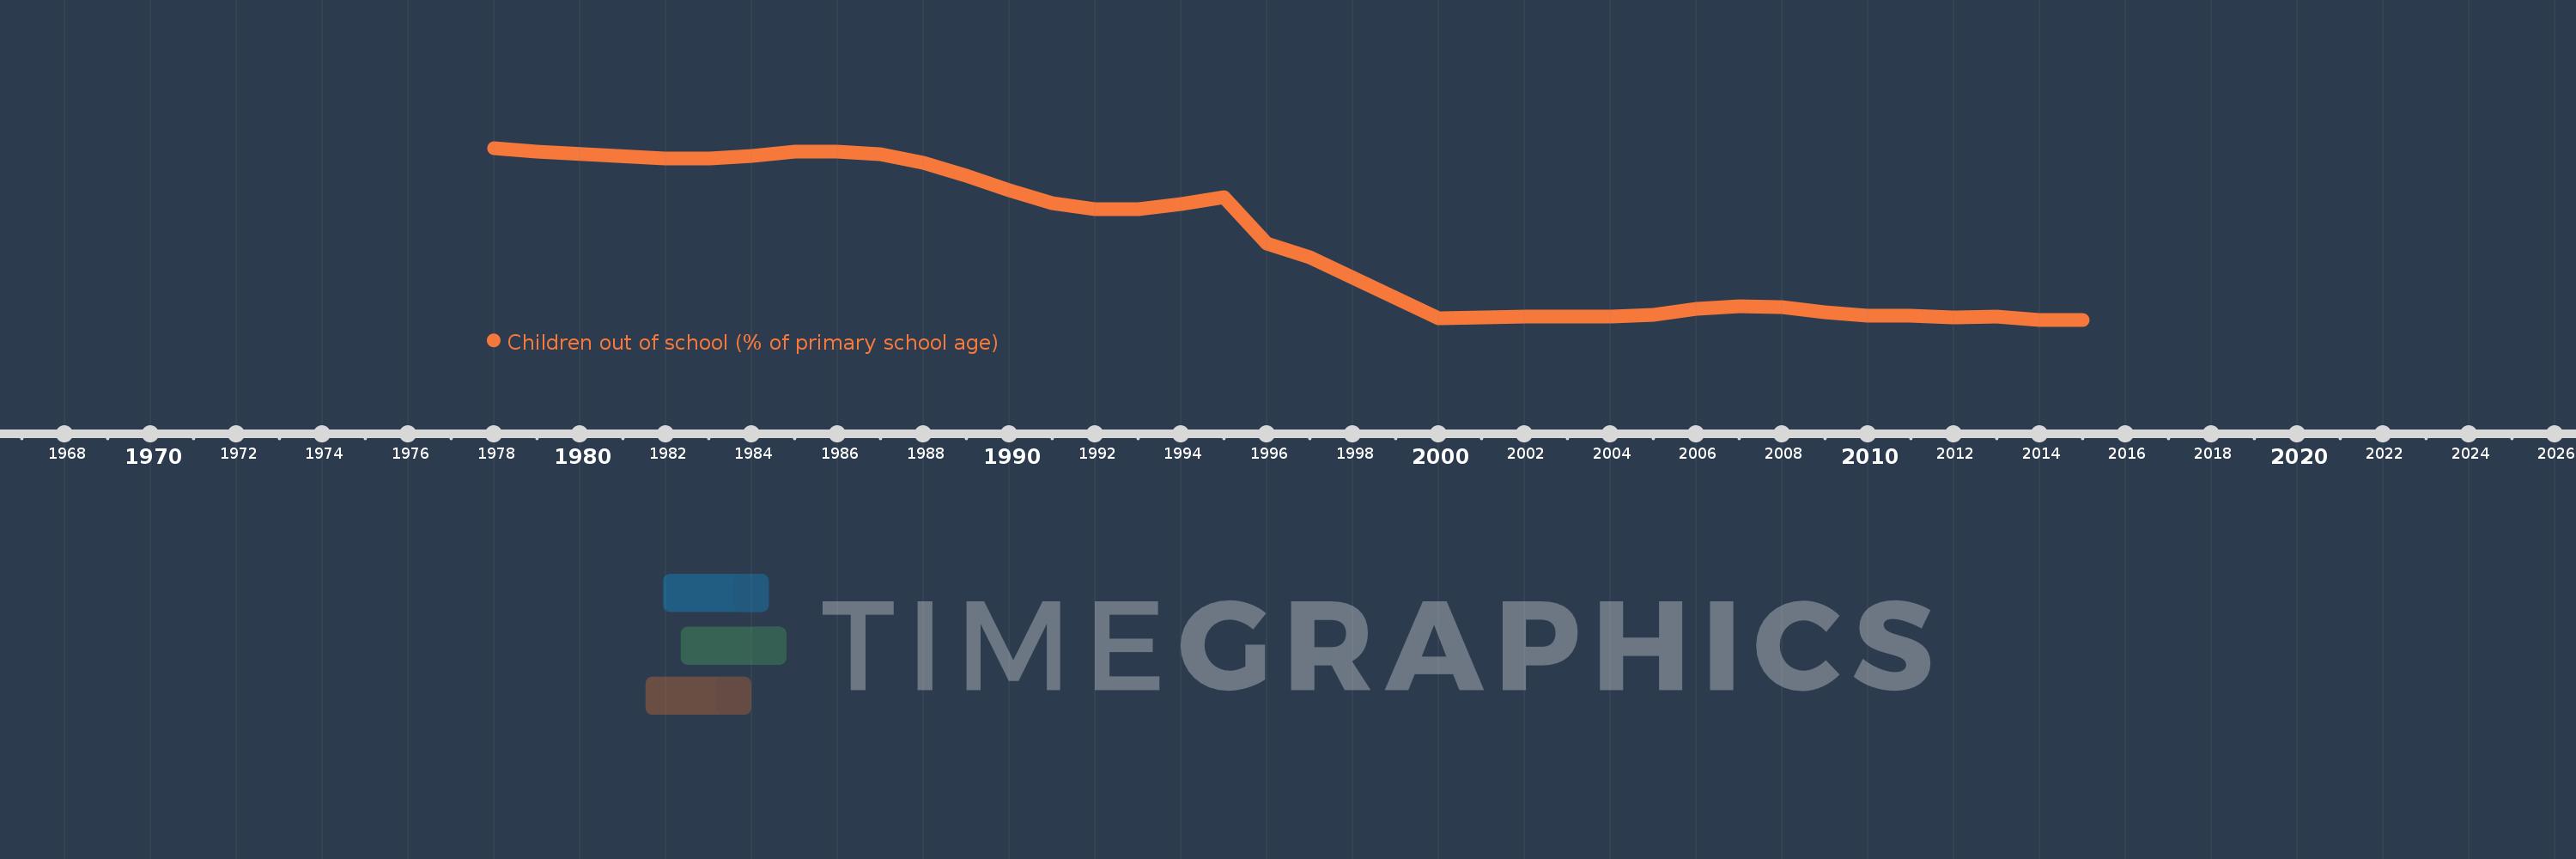
Children out of school (% of primary school age)
2015,2014,2013,2012,2011,2010,2009,2008,2007,2006,2005,2004,2003,2002,2001,2000,1997,1996,1995,1994,1993,1992,1991,1990,1989,1988,1987,1986,1985,1984,1983,1982,1979,1978
Estas estadísticas en otros países:
AfghanistanAlbaniaAlgeriaAngolaAntigua and BarbudaArab WorldArgentinaArmeniaArubaAustraliaAustriaAzerbaijanBahamas, TheBahrainBangladeshBarbadosBelarusBelgiumBelizeBeninBermudaBhutanBoliviaBosnia and HerzegovinaBotswanaBrazilBrunei DarussalamBulgariaBurkina FasoBurundiCabo VerdeCambodiaCameroonCanadaCaribbean small statesCentral African RepublicCentral Europe and the BalticsChadChileChinaColombiaComorosCongo, Dem. Rep.Congo, Rep.Costa RicaCote d'IvoireCroatiaCubaCyprusDenmarkDjiboutiDominicaDominican RepublicEarly-demographic dividendEast Asia & PacificEast Asia & Pacific (excluding high income)East Asia & Pacific (IDA & IBRD countries)EcuadorEgypt, Arab Rep.El SalvadorEquatorial GuineaEritreaEstoniaEthiopiaEuro areaEurope & Central AsiaEurope & Central Asia (excluding high income)Europe & Central Asia (IDA & IBRD countries)European UnionFijiFinlandFragile and conflict affected situationsFranceGabonGambia, TheGeorgiaGermanyGhanaGreeceGrenadaGuatemalaGuineaGuinea-BissauGuyanaHaitiHeavily indebted poor countries (HIPC)High incomeHondurasHong Kong SAR, ChinaHungaryIBRD onlyIcelandIDA & IBRD totalIDA blendIDA onlyIDA totalIndiaIndonesiaIran, Islamic Rep.IraqIrelandIsraelItalyJamaicaJapanJordanKazakhstanKenyaKiribatiKorea, Dem. People’s Rep.Korea, Rep.KuwaitKyrgyz RepublicLao PDRLate-demographic dividendLatin America & Caribbean Latin America & Caribbean (excluding high income)Latin America & the Caribbean (IDA & IBRD countries)LatviaLeast developed countries: UN classificationLebanonLesothoLiberiaLibyaLiechtensteinLithuaniaLow & middle incomeLow incomeLower middle incomeLuxembourgMacao SAR, ChinaMacedonia, FYRMadagascarMalawiMalaysiaMaldivesMaliMaltaMarshall IslandsMauritaniaMauritiusMexicoMicronesia, Fed. Sts.Middle East & North AfricaMiddle East & North Africa (excluding high income)Middle East & North Africa (IDA & IBRD countries)Middle incomeMoldovaMongoliaMontenegroMoroccoMozambiqueMyanmarNamibiaNauruNepalNetherlandsNew ZealandNicaraguaNigerNigeriaNorth AmericaNorwayOECD membersOmanOther small statesPacific island small statesPakistanPalauPanamaPapua New GuineaParaguayPeruPhilippinesPolandPortugalPost-demographic dividendPre-demographic dividendPuerto RicoQatarRomaniaRussian FederationRwandaSamoaSan MarinoSao Tome and PrincipeSaudi ArabiaSenegalSerbiaSeychellesSierra LeoneSloveniaSmall statesSolomon IslandsSomaliaSouth AfricaSouth AsiaSouth Asia (IDA & IBRD)South SudanSpainSri LankaSt. Kitts and NevisSt. LuciaSt. Vincent and the GrenadinesSub-Saharan Africa Sub-Saharan Africa (excluding high income)Sub-Saharan Africa (IDA & IBRD countries)SudanSurinameSwazilandSwedenSwitzerlandSyrian Arab RepublicTajikistanTanzaniaThailandTimor-LesteTogoTongaTrinidad and TobagoTunisiaTurkeyTuvaluUgandaUkraineUnited Arab EmiratesUnited KingdomUnited StatesUpper middle incomeUruguayUzbekistanVanuatuVenezuela, RBVietnamWest Bank and GazaWorldYemen, Rep.ZambiaZimbabwe línea de tiempo (timeline):
En esta escala de tiempo se presenta un gráfico de 1978 y 2015 de Switzerland. Los datos de 1977 están ausentes. El número de observaciones reales por fecha: 34.
Fuente (nombre):
Indicadores del desarrollo mundial
Fuente (organización):
United Nations Educational, Scientific, and Cultural Organization (UNESCO) Institute for Statistics.
Categorías:
Education
Se ha actualizado:
23 abr 2017 año
Los indicadores de los cambios de valor en los últimos años
Mínimo:
0.356
1 ene 2015 año
Máximo:
24.35
1 ene 1978 año
A la fecha de observación
Valor
Cambio absoluto
El cambio con respecto al valor anterior
1 ene 1978 año
24.35
+24.35
0.0%
1 ene 1979 año
23.817
-0.533
-2.19%
1 ene 1982 año
22.861
-0.956
-4.01%
1 ene 1983 año
22.897
+0.037
0.16%
1 ene 1984 año
23.269
+0.372
1.62%
1 ene 1985 año
23.793
+0.524
2.25%
1 ene 1986 año
23.854
+0.06
0.25%
1 ene 1987 año
23.444
-0.409
-1.72%
1 ene 1988 año
22.264
-1.18
-5.03%
1 ene 1989 año
20.477
-1.787
-8.03%
1 ene 1990 año
18.411
-2.066
-10.09%
1 ene 1991 año
16.677
-1.734
-9.42%
1 ene 1992 año
15.849
-0.828
-4.96%
1 ene 1993 año
15.791
-0.058
-0.37%
1 ene 1994 año
16.573
+0.782
4.95%
1 ene 1995 año
17.448
+0.875
5.28%
1 ene 1996 año
11.009
-6.439
-36.9%
1 ene 1997 año
9.088
-1.921
-17.45%
1 ene 2000 año
0.514
-8.574
-94.34%
1 ene 2001 año
0.703
+0.188
36.64%
1 ene 2002 año
0.776
+0.073
10.46%
1 ene 2003 año
0.769
-0.007
-0.89%
1 ene 2004 año
0.765
-0.004
-0.51%
1 ene 2005 año
1.075
+0.31
40.49%
1 ene 2006 año
1.928
+0.852
79.27%
1 ene 2007 año
2.282
+0.354
18.38%
1 ene 2008 año
2.168
-0.114
-4.98%
1 ene 2009 año
1.437
-0.731
-33.73%
1 ene 2010 año
0.954
-0.483
-33.6%
1 ene 2011 año
0.89
-0.064
-6.75%
1 ene 2012 año
0.739
-0.151
-16.92%
1 ene 2013 año
0.772
+0.033
4.46%
1 ene 2014 año
0.364
-0.408
-52.88%
1 ene 2015 año
0.356
-0.008
-2.07%
Ranking de los países por los datos estadísticos actuales


Comentarios: