29
/es/
es
AIzaSyAYiBZKx7MnpbEhh9jyipgxe19OcubqV5w
April 1, 2024
61266
Sub-Saharan Africa (IDA & IBRD countries)
TSS
false
2
1
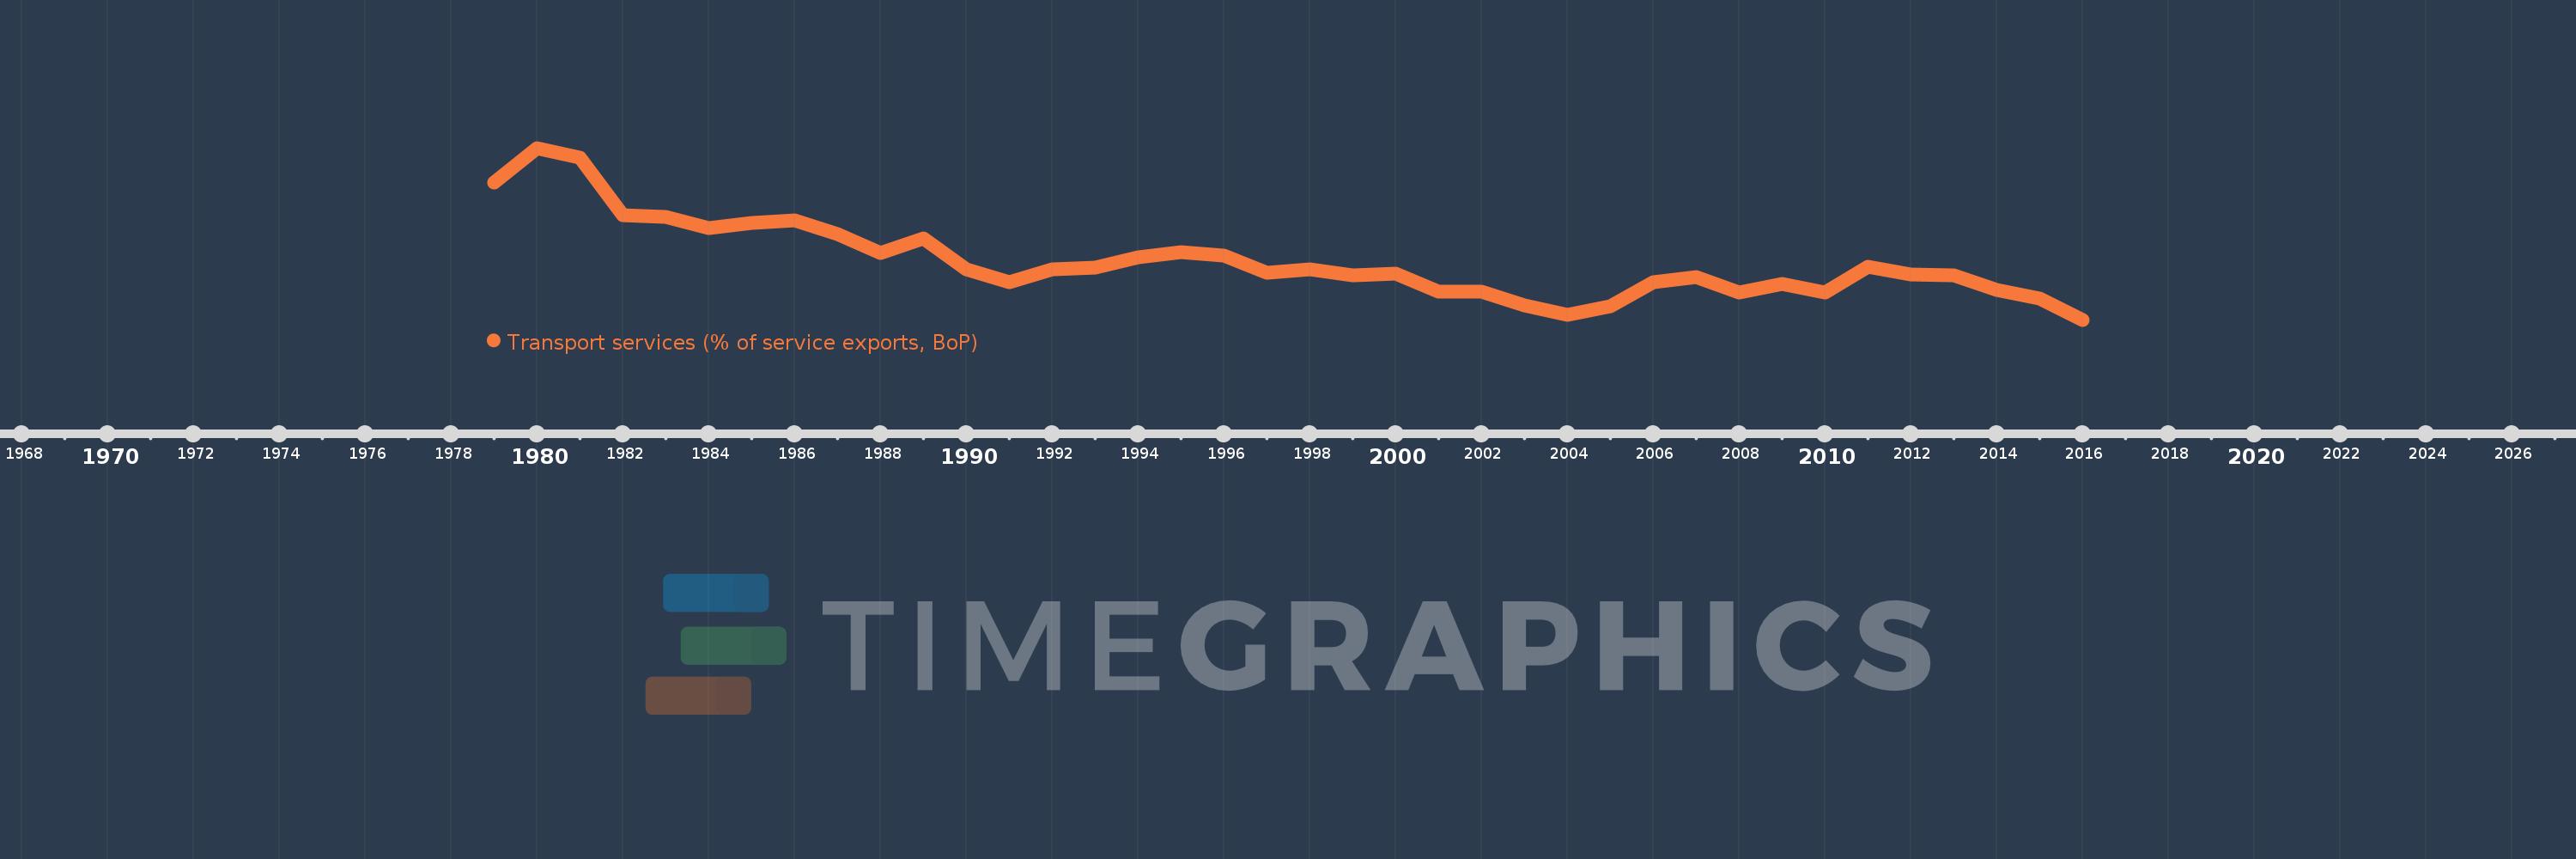
Transport services (% of service exports, BoP)
2016,2015,2014,2013,2012,2011,2010,2009,2008,2007,2006,2005,2004,2003,2002,2001,2000,1999,1998,1997,1996,1995,1994,1993,1992,1991,1990,1989,1988,1987,1986,1985,1984,1983,1982,1981,1980,1979
Estas estadísticas en otros países:
AfghanistanAlbaniaAlgeriaAngolaAntigua and BarbudaArab WorldArgentinaArmeniaArubaAustraliaAustriaAzerbaijanBahamas, TheBahrainBangladeshBarbadosBelarusBelgiumBelizeBeninBermudaBhutanBoliviaBosnia and HerzegovinaBotswanaBrazilBrunei DarussalamBulgariaBurkina FasoBurundiCabo VerdeCambodiaCameroonCanadaCaribbean small statesCentral African RepublicCentral Europe and the BalticsChadChileChinaColombiaComorosCongo, Dem. Rep.Congo, Rep.Costa RicaCote d'IvoireCroatiaCuracaoCyprusCzech RepublicDenmarkDjiboutiDominicaDominican RepublicEarly-demographic dividendEast Asia & PacificEast Asia & Pacific (excluding high income)East Asia & Pacific (IDA & IBRD countries)EcuadorEgypt, Arab Rep.El SalvadorEritreaEstoniaEthiopiaEuro areaEurope & Central AsiaEurope & Central Asia (excluding high income)Europe & Central Asia (IDA & IBRD countries)European UnionFaroe IslandsFijiFinlandFragile and conflict affected situationsFranceFrench PolynesiaGabonGambia, TheGeorgiaGermanyGhanaGreeceGrenadaGuatemalaGuineaGuinea-BissauGuyanaHaitiHeavily indebted poor countries (HIPC)High incomeHondurasHong Kong SAR, ChinaHungaryIBRD onlyIcelandIDA & IBRD totalIDA onlyIDA totalIndiaIndonesiaIran, Islamic Rep.IraqIrelandIsraelItalyJamaicaJapanJordanKazakhstanKenyaKiribatiKorea, Rep.KosovoKuwaitKyrgyz RepublicLao PDRLate-demographic dividendLatin America & Caribbean Latin America & Caribbean (excluding high income)Latin America & the Caribbean (IDA & IBRD countries)LatviaLeast developed countries: UN classificationLebanonLesothoLiberiaLibyaLithuaniaLow & middle incomeLow incomeLower middle incomeLuxembourgMacao SAR, ChinaMacedonia, FYRMadagascarMalawiMalaysiaMaldivesMaliMaltaMarshall IslandsMauritaniaMauritiusMexicoMicronesia, Fed. Sts.Middle East & North AfricaMiddle East & North Africa (excluding high income)Middle East & North Africa (IDA & IBRD countries)Middle incomeMoldovaMongoliaMontenegroMoroccoMozambiqueMyanmarNamibiaNepalNetherlandsNew CaledoniaNew ZealandNicaraguaNigerNigeriaNorth AmericaNorwayOECD membersOmanOther small statesPacific island small statesPakistanPalauPanamaPapua New GuineaParaguayPeruPhilippinesPolandPortugalPost-demographic dividendPre-demographic dividendQatarRomaniaRussian FederationRwandaSamoaSao Tome and PrincipeSaudi ArabiaSenegalSerbiaSeychellesSierra LeoneSingaporeSint Maarten (Dutch part)Slovak RepublicSloveniaSmall statesSolomon IslandsSouth AfricaSouth AsiaSouth Asia (IDA & IBRD)South SudanSpainSri LankaSt. Kitts and NevisSt. LuciaSt. Vincent and the GrenadinesSub-Saharan Africa Sub-Saharan Africa (excluding high income)Sub-Saharan Africa (IDA & IBRD countries)SudanSurinameSwazilandSwedenSwitzerlandSyrian Arab RepublicTajikistanTanzaniaThailandTimor-LesteTogoTongaTrinidad and TobagoTunisiaTurkeyTuvaluUgandaUkraineUnited KingdomUnited StatesUpper middle incomeUruguayVanuatuVenezuela, RBWest Bank and GazaWorldYemen, Rep.ZambiaZimbabwe línea de tiempo (timeline):
En esta escala de tiempo se presenta un gráfico de 1979 y 2016 de Sub-Saharan Africa (IDA & IBRD countries). Los datos de 1978 están ausentes. El número de observaciones reales por fecha: 38.
Fuente (nombre):
Indicadores del desarrollo mundial
Fuente (organización):
International Monetary Fund, Balance of Payments Statistics Yearbook and data files.
Categorías:
Economy & Growth, Trade
Se ha actualizado:
23 abr 2017 año
Los indicadores de los cambios de valor en los últimos años
Mínimo:
18.664
1 ene 2016 año
Máximo:
40.534
1 ene 1980 año
A la fecha de observación
Valor
Cambio absoluto
El cambio con respecto al valor anterior
1 ene 1979 año
36.136
+36.136
0.0%
1 ene 1980 año
40.534
+4.398
12.17%
1 ene 1981 año
39.283
-1.251
-3.09%
1 ene 1982 año
31.991
-7.292
-18.56%
1 ene 1983 año
31.714
-0.277
-0.87%
1 ene 1984 año
30.371
-1.343
-4.23%
1 ene 1985 año
30.981
+0.61
2.01%
1 ene 1986 año
31.263
+0.282
0.91%
1 ene 1987 año
29.552
-1.711
-5.47%
1 ene 1988 año
27.18
-2.372
-8.03%
1 ene 1989 año
29.003
+1.824
6.71%
1 ene 1990 año
25.056
-3.947
-13.61%
1 ene 1991 año
23.457
-1.599
-6.38%
1 ene 1992 año
25.051
+1.594
6.8%
1 ene 1993 año
25.28
+0.229
0.92%
1 ene 1994 año
26.631
+1.351
5.34%
1 ene 1995 año
27.272
+0.64
2.41%
1 ene 1996 año
26.853
-0.419
-1.54%
1 ene 1997 año
24.641
-2.212
-8.24%
1 ene 1998 año
25.088
+0.447
1.81%
1 ene 1999 año
24.276
-0.811
-3.23%
1 ene 2000 año
24.541
+0.265
1.09%
1 ene 2001 año
22.192
-2.349
-9.57%
1 ene 2002 año
22.207
+0.015
0.07%
1 ene 2003 año
20.468
-1.74
-7.83%
1 ene 2004 año
19.244
-1.223
-5.98%
1 ene 2005 año
20.405
+1.161
6.03%
1 ene 2006 año
23.478
+3.072
15.06%
1 ene 2007 año
24.103
+0.626
2.66%
1 ene 2008 año
22.146
-1.957
-8.12%
1 ene 2009 año
23.267
+1.121
5.06%
1 ene 2010 año
22.11
-1.157
-4.97%
1 ene 2011 año
25.418
+3.308
14.96%
1 ene 2012 año
24.376
-1.042
-4.1%
1 ene 2013 año
24.319
-0.057
-0.23%
1 ene 2014 año
22.509
-1.81
-7.44%
1 ene 2015 año
21.358
-1.151
-5.12%
1 ene 2016 año
18.664
-2.693
-12.61%
Ranking de los países por los datos estadísticos actuales


Comentarios: