29
/es/
es
AIzaSyAYiBZKx7MnpbEhh9jyipgxe19OcubqV5w
April 1, 2024
51581
Middle income
MIC
false
2
1
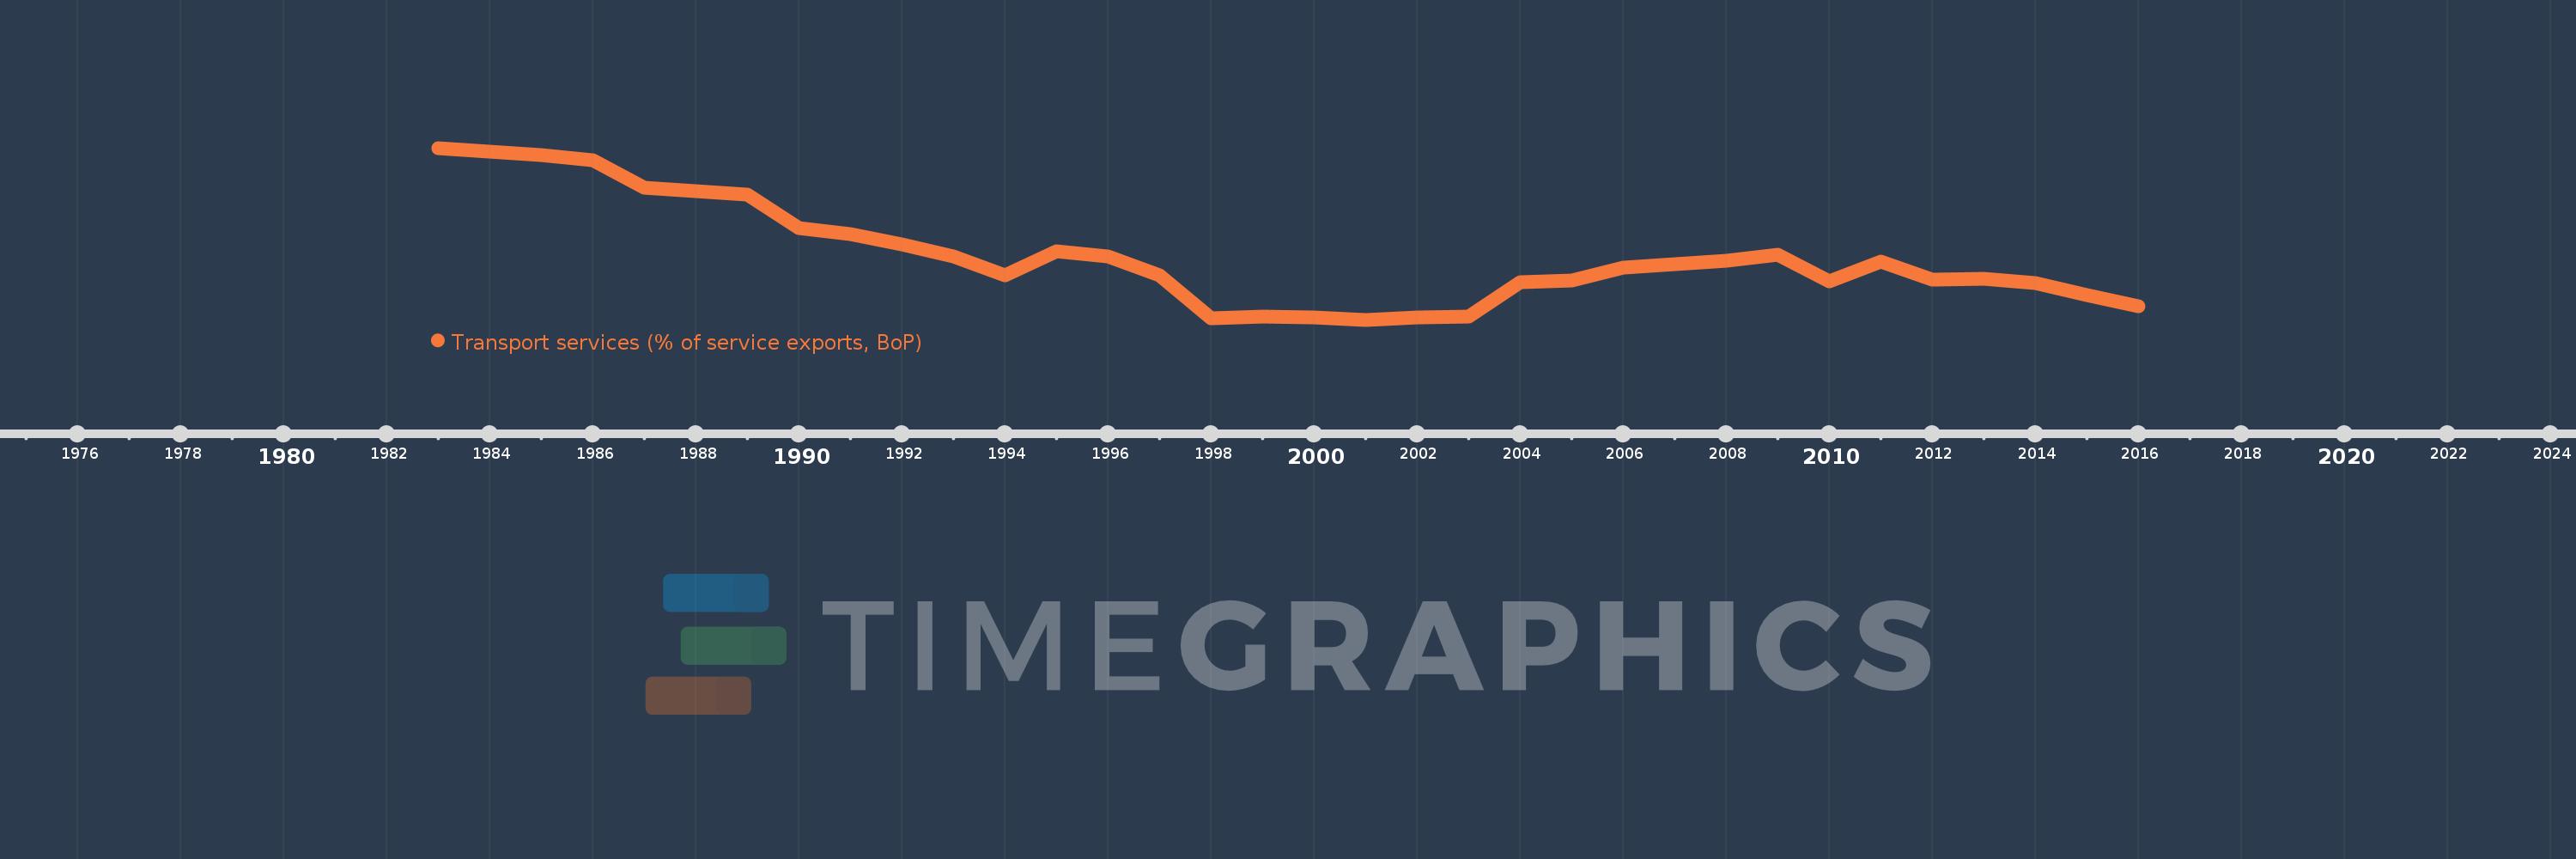
Transport services (% of service exports, BoP)
2016,2015,2014,2013,2012,2011,2010,2009,2008,2007,2006,2005,2004,2003,2002,2001,2000,1999,1998,1997,1996,1995,1994,1993,1992,1991,1990,1989,1988,1987,1986,1985,1984,1983
Estas estadísticas en otros países:
AfghanistanAlbaniaAlgeriaAngolaAntigua and BarbudaArab WorldArgentinaArmeniaArubaAustraliaAustriaAzerbaijanBahamas, TheBahrainBangladeshBarbadosBelarusBelgiumBelizeBeninBermudaBhutanBoliviaBosnia and HerzegovinaBotswanaBrazilBrunei DarussalamBulgariaBurkina FasoBurundiCabo VerdeCambodiaCameroonCanadaCaribbean small statesCentral African RepublicCentral Europe and the BalticsChadChileChinaColombiaComorosCongo, Dem. Rep.Congo, Rep.Costa RicaCote d'IvoireCroatiaCuracaoCyprusCzech RepublicDenmarkDjiboutiDominicaDominican RepublicEarly-demographic dividendEast Asia & PacificEast Asia & Pacific (excluding high income)East Asia & Pacific (IDA & IBRD countries)EcuadorEgypt, Arab Rep.El SalvadorEritreaEstoniaEthiopiaEuro areaEurope & Central AsiaEurope & Central Asia (excluding high income)Europe & Central Asia (IDA & IBRD countries)European UnionFaroe IslandsFijiFinlandFragile and conflict affected situationsFranceFrench PolynesiaGabonGambia, TheGeorgiaGermanyGhanaGreeceGrenadaGuatemalaGuineaGuinea-BissauGuyanaHaitiHeavily indebted poor countries (HIPC)High incomeHondurasHong Kong SAR, ChinaHungaryIBRD onlyIcelandIDA & IBRD totalIDA onlyIDA totalIndiaIndonesiaIran, Islamic Rep.IraqIrelandIsraelItalyJamaicaJapanJordanKazakhstanKenyaKiribatiKorea, Rep.KosovoKuwaitKyrgyz RepublicLao PDRLate-demographic dividendLatin America & Caribbean Latin America & Caribbean (excluding high income)Latin America & the Caribbean (IDA & IBRD countries)LatviaLeast developed countries: UN classificationLebanonLesothoLiberiaLibyaLithuaniaLow & middle incomeLow incomeLower middle incomeLuxembourgMacao SAR, ChinaMacedonia, FYRMadagascarMalawiMalaysiaMaldivesMaliMaltaMarshall IslandsMauritaniaMauritiusMexicoMicronesia, Fed. Sts.Middle East & North AfricaMiddle East & North Africa (excluding high income)Middle East & North Africa (IDA & IBRD countries)Middle incomeMoldovaMongoliaMontenegroMoroccoMozambiqueMyanmarNamibiaNepalNetherlandsNew CaledoniaNew ZealandNicaraguaNigerNigeriaNorth AmericaNorwayOECD membersOmanOther small statesPacific island small statesPakistanPalauPanamaPapua New GuineaParaguayPeruPhilippinesPolandPortugalPost-demographic dividendPre-demographic dividendQatarRomaniaRussian FederationRwandaSamoaSao Tome and PrincipeSaudi ArabiaSenegalSerbiaSeychellesSierra LeoneSingaporeSint Maarten (Dutch part)Slovak RepublicSloveniaSmall statesSolomon IslandsSouth AfricaSouth AsiaSouth Asia (IDA & IBRD)South SudanSpainSri LankaSt. Kitts and NevisSt. LuciaSt. Vincent and the GrenadinesSub-Saharan Africa Sub-Saharan Africa (excluding high income)Sub-Saharan Africa (IDA & IBRD countries)SudanSurinameSwazilandSwedenSwitzerlandSyrian Arab RepublicTajikistanTanzaniaThailandTimor-LesteTogoTongaTrinidad and TobagoTunisiaTurkeyTuvaluUgandaUkraineUnited KingdomUnited StatesUpper middle incomeUruguayVanuatuVenezuela, RBWest Bank and GazaWorldYemen, Rep.ZambiaZimbabwe línea de tiempo (timeline):
En esta escala de tiempo se presenta un gráfico de 1983 y 2016 de Middle income. Los datos de 1982 están ausentes. El número de observaciones reales por fecha: 34.
Fuente (nombre):
Indicadores del desarrollo mundial
Fuente (organización):
International Monetary Fund, Balance of Payments Statistics Yearbook and data files.
Categorías:
Economy & Growth, Trade
Se ha actualizado:
23 abr 2017 año
Los indicadores de los cambios de valor en los últimos años
Mínimo:
15.741
1 ene 2001 año
Máximo:
31.727
1 ene 1983 año
A la fecha de observación
Valor
Cambio absoluto
El cambio con respecto al valor anterior
1 ene 1983 año
31.727
+31.727
0.0%
1 ene 1984 año
31.402
-0.325
-1.02%
1 ene 1985 año
31.083
-0.319
-1.02%
1 ene 1986 año
30.576
-0.507
-1.63%
1 ene 1987 año
27.989
-2.587
-8.46%
1 ene 1988 año
27.713
-0.276
-0.99%
1 ene 1989 año
27.374
-0.339
-1.22%
1 ene 1990 año
24.295
-3.079
-11.25%
1 ene 1991 año
23.731
-0.564
-2.32%
1 ene 1992 año
22.741
-0.991
-4.17%
1 ene 1993 año
21.62
-1.121
-4.93%
1 ene 1994 año
19.857
-1.763
-8.15%
1 ene 1995 año
22.085
+2.228
11.22%
1 ene 1996 año
21.626
-0.459
-2.08%
1 ene 1997 año
19.899
-1.727
-7.99%
1 ene 1998 año
15.848
-4.051
-20.36%
1 ene 1999 año
16.03
+0.182
1.15%
1 ene 2000 año
15.951
-0.079
-0.49%
1 ene 2001 año
15.741
-0.211
-1.32%
1 ene 2002 año
15.981
+0.24
1.53%
1 ene 2003 año
16.04
+0.059
0.37%
1 ene 2004 año
19.218
+3.178
19.81%
1 ene 2005 año
19.365
+0.146
0.76%
1 ene 2006 año
20.609
+1.244
6.43%
1 ene 2007 año
20.911
+0.302
1.47%
1 ene 2008 año
21.23
+0.318
1.52%
1 ene 2009 año
21.801
+0.572
2.69%
1 ene 2010 año
19.333
-2.468
-11.32%
1 ene 2011 año
21.113
+1.78
9.21%
1 ene 2012 año
19.479
-1.635
-7.74%
1 ene 2013 año
19.523
+0.045
0.23%
1 ene 2014 año
19.177
-0.346
-1.77%
1 ene 2015 año
18.037
-1.14
-5.94%
1 ene 2016 año
17.02
-1.017
-5.64%
Ranking de los países por los datos estadísticos actuales


Comentarios: