29
/es/
es
AIzaSyAYiBZKx7MnpbEhh9jyipgxe19OcubqV5w
April 1, 2024
168330
Kenya
KEN
true
2
1
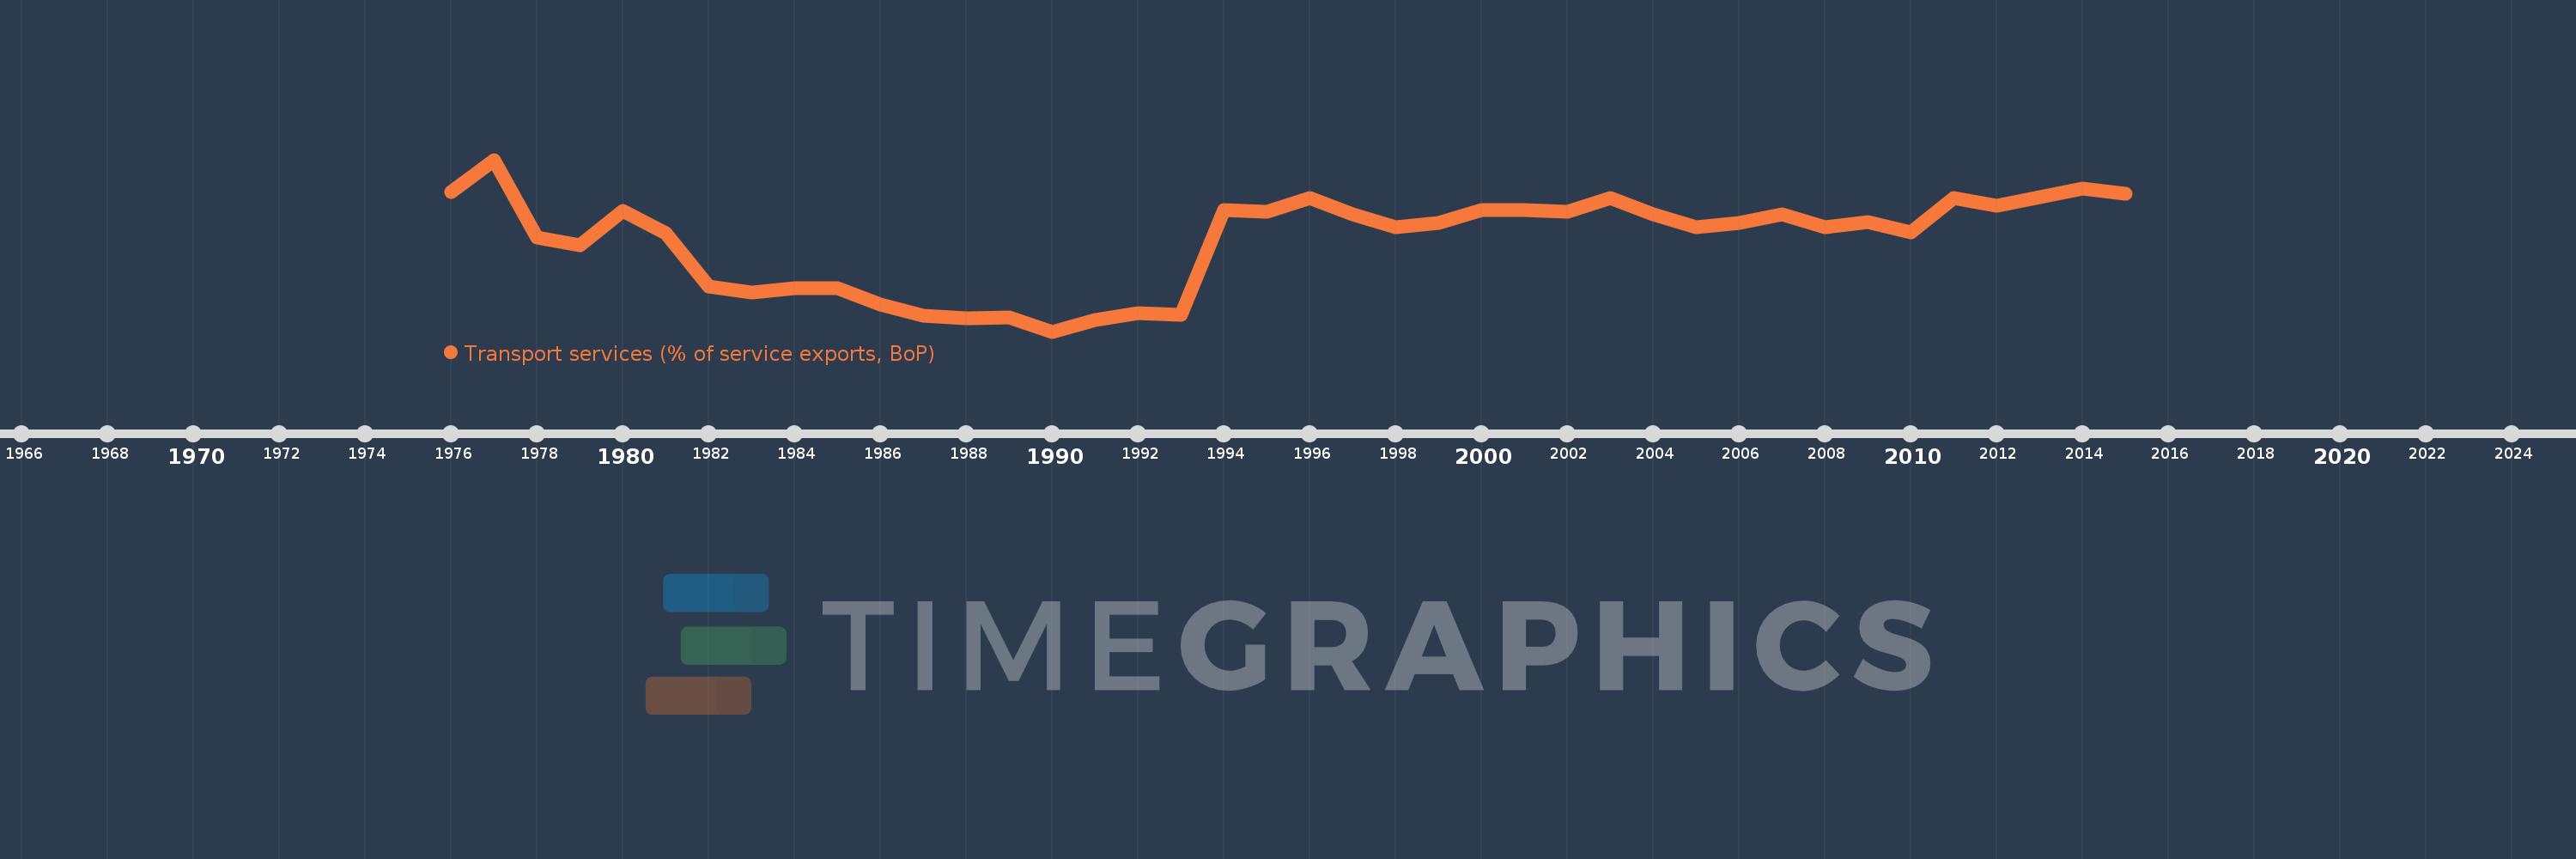
Transport services (% of service exports, BoP)
2015,2014,2013,2012,2011,2010,2009,2008,2007,2006,2005,2004,2003,2002,2001,2000,1999,1998,1997,1996,1995,1994,1993,1992,1991,1990,1989,1988,1987,1986,1985,1984,1983,1982,1981,1980,1979,1978,1977,1976
Estas estadísticas en otros países:
AfghanistanAlbaniaAlgeriaAngolaAntigua and BarbudaArab WorldArgentinaArmeniaArubaAustraliaAustriaAzerbaijanBahamas, TheBahrainBangladeshBarbadosBelarusBelgiumBelizeBeninBermudaBhutanBoliviaBosnia and HerzegovinaBotswanaBrazilBrunei DarussalamBulgariaBurkina FasoBurundiCabo VerdeCambodiaCameroonCanadaCaribbean small statesCentral African RepublicCentral Europe and the BalticsChadChileChinaColombiaComorosCongo, Dem. Rep.Congo, Rep.Costa RicaCote d'IvoireCroatiaCuracaoCyprusCzech RepublicDenmarkDjiboutiDominicaDominican RepublicEarly-demographic dividendEast Asia & PacificEast Asia & Pacific (excluding high income)East Asia & Pacific (IDA & IBRD countries)EcuadorEgypt, Arab Rep.El SalvadorEritreaEstoniaEthiopiaEuro areaEurope & Central AsiaEurope & Central Asia (excluding high income)Europe & Central Asia (IDA & IBRD countries)European UnionFaroe IslandsFijiFinlandFragile and conflict affected situationsFranceFrench PolynesiaGabonGambia, TheGeorgiaGermanyGhanaGreeceGrenadaGuatemalaGuineaGuinea-BissauGuyanaHaitiHeavily indebted poor countries (HIPC)High incomeHondurasHong Kong SAR, ChinaHungaryIBRD onlyIcelandIDA & IBRD totalIDA onlyIDA totalIndiaIndonesiaIran, Islamic Rep.IraqIrelandIsraelItalyJamaicaJapanJordanKazakhstanKenyaKiribatiKorea, Rep.KosovoKuwaitKyrgyz RepublicLao PDRLate-demographic dividendLatin America & Caribbean Latin America & Caribbean (excluding high income)Latin America & the Caribbean (IDA & IBRD countries)LatviaLeast developed countries: UN classificationLebanonLesothoLiberiaLibyaLithuaniaLow & middle incomeLow incomeLower middle incomeLuxembourgMacao SAR, ChinaMacedonia, FYRMadagascarMalawiMalaysiaMaldivesMaliMaltaMarshall IslandsMauritaniaMauritiusMexicoMicronesia, Fed. Sts.Middle East & North AfricaMiddle East & North Africa (excluding high income)Middle East & North Africa (IDA & IBRD countries)Middle incomeMoldovaMongoliaMontenegroMoroccoMozambiqueMyanmarNamibiaNepalNetherlandsNew CaledoniaNew ZealandNicaraguaNigerNigeriaNorth AmericaNorwayOECD membersOmanOther small statesPacific island small statesPakistanPalauPanamaPapua New GuineaParaguayPeruPhilippinesPolandPortugalPost-demographic dividendPre-demographic dividendQatarRomaniaRussian FederationRwandaSamoaSao Tome and PrincipeSaudi ArabiaSenegalSerbiaSeychellesSierra LeoneSingaporeSint Maarten (Dutch part)Slovak RepublicSloveniaSmall statesSolomon IslandsSouth AfricaSouth AsiaSouth Asia (IDA & IBRD)South SudanSpainSri LankaSt. Kitts and NevisSt. LuciaSt. Vincent and the GrenadinesSub-Saharan Africa Sub-Saharan Africa (excluding high income)Sub-Saharan Africa (IDA & IBRD countries)SudanSurinameSwazilandSwedenSwitzerlandSyrian Arab RepublicTajikistanTanzaniaThailandTimor-LesteTogoTongaTrinidad and TobagoTunisiaTurkeyTuvaluUgandaUkraineUnited KingdomUnited StatesUpper middle incomeUruguayVanuatuVenezuela, RBWest Bank and GazaWorldYemen, Rep.ZambiaZimbabwe línea de tiempo (timeline):
En esta escala de tiempo se presenta un gráfico de 1976 y 2015 de Kenya. Los datos de 1975 están ausentes. El número de observaciones reales por fecha: 40.
Fuente (nombre):
Indicadores del desarrollo mundial
Fuente (organización):
International Monetary Fund, Balance of Payments Statistics Yearbook and data files.
Categorías:
Economy & Growth, Trade
Se ha actualizado:
23 abr 2017 año
Los indicadores de los cambios de valor en los últimos años
Mínimo:
19.718
1 ene 1990 año
Máximo:
50.592
1 ene 1977 año
A la fecha de observación
Valor
Cambio absoluto
El cambio con respecto al valor anterior
1 ene 1976 año
44.83
+44.83
0.0%
1 ene 1977 año
50.592
+5.763
12.85%
1 ene 1978 año
36.626
-13.966
-27.61%
1 ene 1979 año
35.189
-1.438
-3.93%
1 ene 1980 año
41.429
+6.24
17.73%
1 ene 1981 año
37.426
-4.003
-9.66%
1 ene 1982 año
27.877
-9.549
-25.52%
1 ene 1983 año
26.802
-1.075
-3.85%
1 ene 1984 año
27.514
+0.712
2.66%
1 ene 1985 año
27.527
+0.013
0.05%
1 ene 1986 año
24.643
-2.884
-10.48%
1 ene 1987 año
22.583
-2.06
-8.36%
1 ene 1988 año
22.158
-0.425
-1.88%
1 ene 1989 año
22.241
+0.083
0.38%
1 ene 1990 año
19.718
-2.524
-11.35%
1 ene 1991 año
21.781
+2.063
10.46%
1 ene 1992 año
23.049
+1.268
5.82%
1 ene 1993 año
22.794
-0.255
-1.11%
1 ene 1994 año
41.488
+18.694
82.01%
1 ene 1995 año
41.246
-0.242
-0.58%
1 ene 1996 año
43.659
+2.412
5.85%
1 ene 1997 año
40.775
-2.883
-6.6%
1 ene 1998 año
38.488
-2.288
-5.61%
1 ene 1999 año
39.183
+0.695
1.81%
1 ene 2000 año
41.504
+2.321
5.92%
1 ene 2001 año
41.488
-0.016
-0.04%
1 ene 2002 año
41.246
-0.242
-0.58%
1 ene 2003 año
43.659
+2.412
5.85%
1 ene 2004 año
40.775
-2.883
-6.6%
1 ene 2005 año
38.488
-2.288
-5.61%
1 ene 2006 año
39.18
+0.692
1.8%
1 ene 2007 año
40.745
+1.565
3.99%
1 ene 2008 año
38.471
-2.273
-5.58%
1 ene 2009 año
39.452
+0.98
2.55%
1 ene 2010 año
37.491
-1.961
-4.97%
1 ene 2011 año
43.738
+6.247
16.66%
1 ene 2012 año
42.368
-1.37
-3.13%
1 ene 2013 año
43.808
+1.44
3.4%
1 ene 2014 año
45.449
+1.641
3.75%
1 ene 2015 año
44.418
-1.031
-2.27%
Ranking de los países por los datos estadísticos actuales


Comentarios: