29
/es/
es
AIzaSyAYiBZKx7MnpbEhh9jyipgxe19OcubqV5w
April 1, 2024
244315
Solomon Islands
SLB
true
2
1
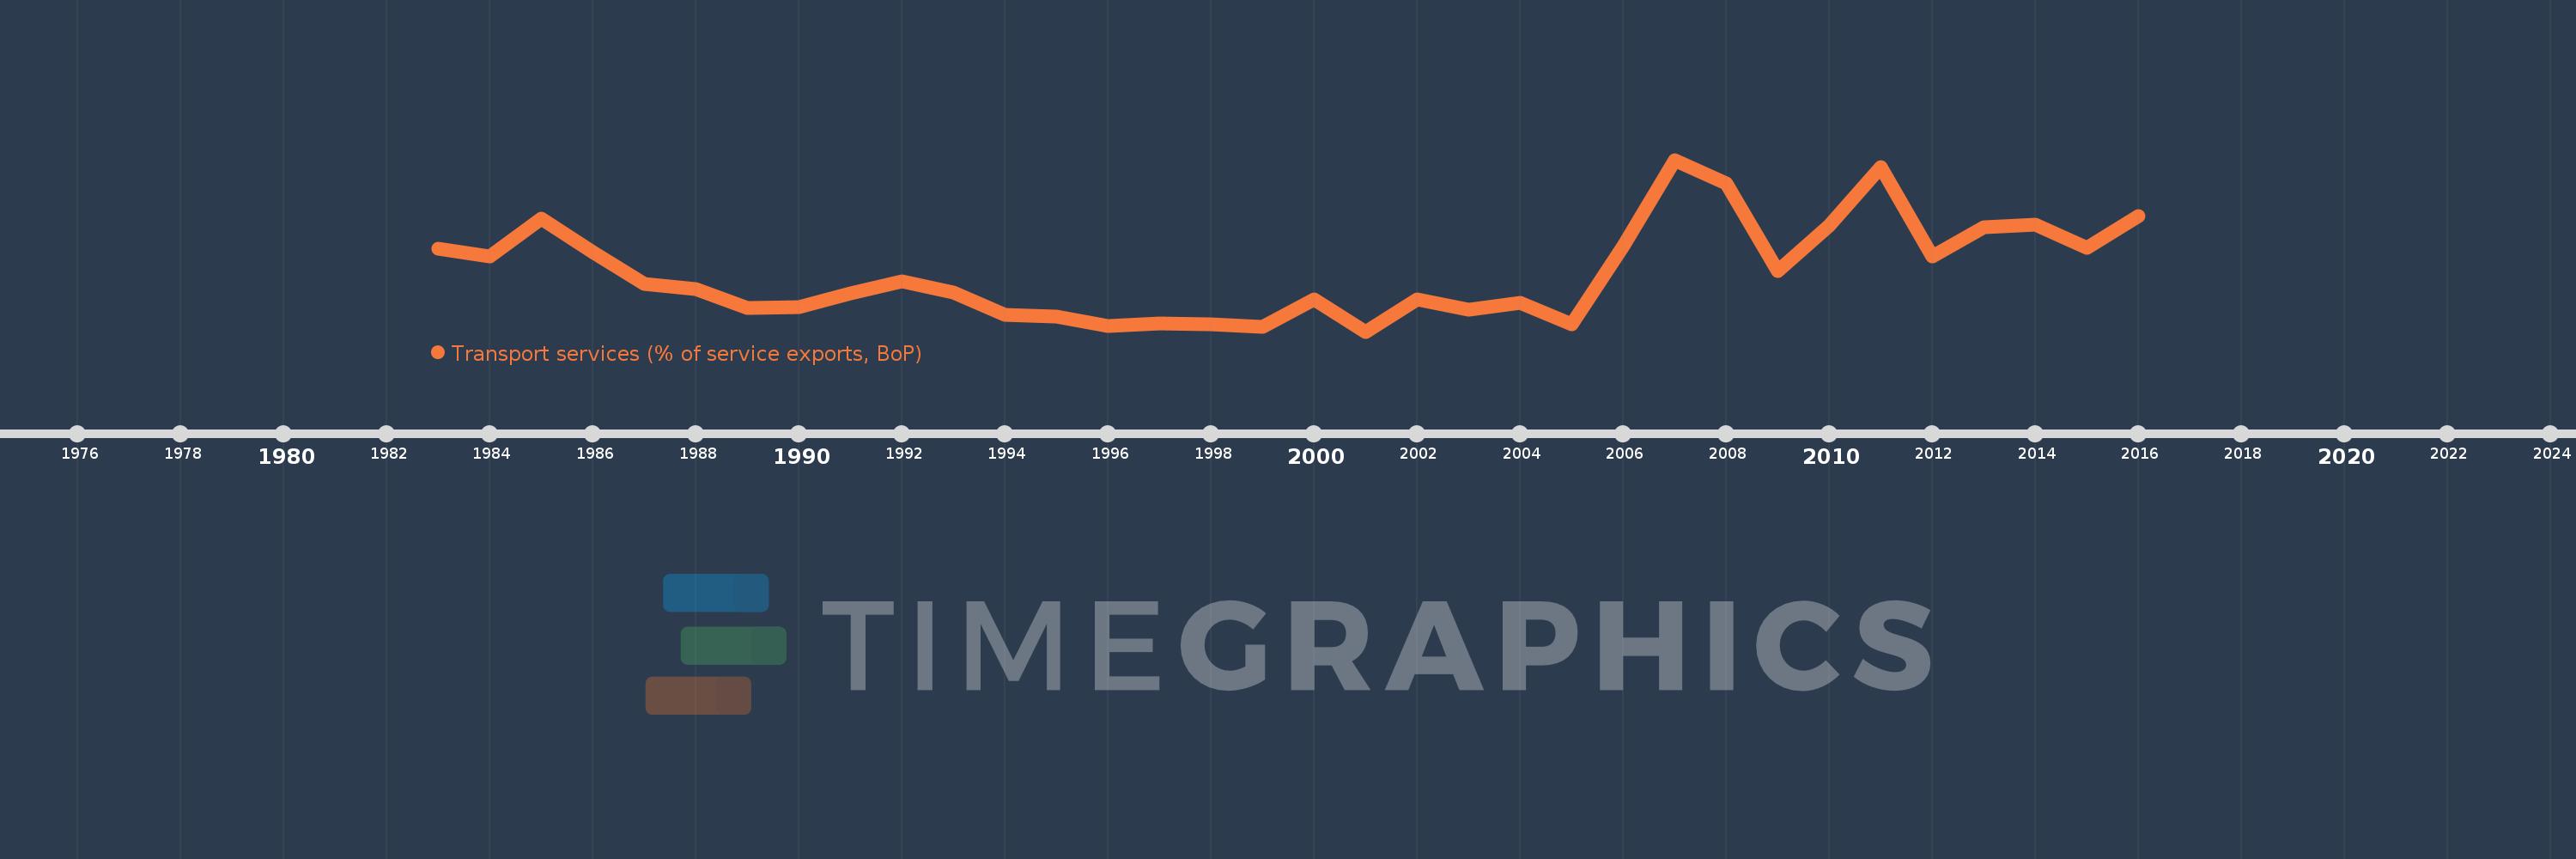
Transport services (% of service exports, BoP)
2016,2015,2014,2013,2012,2011,2010,2009,2008,2007,2006,2005,2004,2003,2002,2001,2000,1999,1998,1997,1996,1995,1994,1993,1992,1991,1990,1989,1988,1987,1986,1985,1984,1983
Estas estadísticas en otros países:
AfghanistanAlbaniaAlgeriaAngolaAntigua and BarbudaArab WorldArgentinaArmeniaArubaAustraliaAustriaAzerbaijanBahamas, TheBahrainBangladeshBarbadosBelarusBelgiumBelizeBeninBermudaBhutanBoliviaBosnia and HerzegovinaBotswanaBrazilBrunei DarussalamBulgariaBurkina FasoBurundiCabo VerdeCambodiaCameroonCanadaCaribbean small statesCentral African RepublicCentral Europe and the BalticsChadChileChinaColombiaComorosCongo, Dem. Rep.Congo, Rep.Costa RicaCote d'IvoireCroatiaCuracaoCyprusCzech RepublicDenmarkDjiboutiDominicaDominican RepublicEarly-demographic dividendEast Asia & PacificEast Asia & Pacific (excluding high income)East Asia & Pacific (IDA & IBRD countries)EcuadorEgypt, Arab Rep.El SalvadorEritreaEstoniaEthiopiaEuro areaEurope & Central AsiaEurope & Central Asia (excluding high income)Europe & Central Asia (IDA & IBRD countries)European UnionFaroe IslandsFijiFinlandFragile and conflict affected situationsFranceFrench PolynesiaGabonGambia, TheGeorgiaGermanyGhanaGreeceGrenadaGuatemalaGuineaGuinea-BissauGuyanaHaitiHeavily indebted poor countries (HIPC)High incomeHondurasHong Kong SAR, ChinaHungaryIBRD onlyIcelandIDA & IBRD totalIDA onlyIDA totalIndiaIndonesiaIran, Islamic Rep.IraqIrelandIsraelItalyJamaicaJapanJordanKazakhstanKenyaKiribatiKorea, Rep.KosovoKuwaitKyrgyz RepublicLao PDRLate-demographic dividendLatin America & Caribbean Latin America & Caribbean (excluding high income)Latin America & the Caribbean (IDA & IBRD countries)LatviaLeast developed countries: UN classificationLebanonLesothoLiberiaLibyaLithuaniaLow & middle incomeLow incomeLower middle incomeLuxembourgMacao SAR, ChinaMacedonia, FYRMadagascarMalawiMalaysiaMaldivesMaliMaltaMarshall IslandsMauritaniaMauritiusMexicoMicronesia, Fed. Sts.Middle East & North AfricaMiddle East & North Africa (excluding high income)Middle East & North Africa (IDA & IBRD countries)Middle incomeMoldovaMongoliaMontenegroMoroccoMozambiqueMyanmarNamibiaNepalNetherlandsNew CaledoniaNew ZealandNicaraguaNigerNigeriaNorth AmericaNorwayOECD membersOmanOther small statesPacific island small statesPakistanPalauPanamaPapua New GuineaParaguayPeruPhilippinesPolandPortugalPost-demographic dividendPre-demographic dividendQatarRomaniaRussian FederationRwandaSamoaSao Tome and PrincipeSaudi ArabiaSenegalSerbiaSeychellesSierra LeoneSingaporeSint Maarten (Dutch part)Slovak RepublicSloveniaSmall statesSolomon IslandsSouth AfricaSouth AsiaSouth Asia (IDA & IBRD)South SudanSpainSri LankaSt. Kitts and NevisSt. LuciaSt. Vincent and the GrenadinesSub-Saharan Africa Sub-Saharan Africa (excluding high income)Sub-Saharan Africa (IDA & IBRD countries)SudanSurinameSwazilandSwedenSwitzerlandSyrian Arab RepublicTajikistanTanzaniaThailandTimor-LesteTogoTongaTrinidad and TobagoTunisiaTurkeyTuvaluUgandaUkraineUnited KingdomUnited StatesUpper middle incomeUruguayVanuatuVenezuela, RBWest Bank and GazaWorldYemen, Rep.ZambiaZimbabwe línea de tiempo (timeline):
En esta escala de tiempo se presenta un gráfico de 1983 y 2016 de Solomon Islands. Los datos de 1982 están ausentes. El número de observaciones reales por fecha: 34.
Fuente (nombre):
Indicadores del desarrollo mundial
Fuente (organización):
International Monetary Fund, Balance of Payments Statistics Yearbook and data files.
Categorías:
Economy & Growth, Trade
Se ha actualizado:
23 abr 2017 año
Los indicadores de los cambios de valor en los últimos años
Mínimo:
2.182
1 ene 2001 año
Máximo:
36.512
1 ene 2007 año
A la fecha de observación
Valor
Cambio absoluto
El cambio con respecto al valor anterior
1 ene 1983 año
18.797
+18.797
0.0%
1 ene 1984 año
17.241
-1.556
-8.28%
1 ene 1985 año
24.793
+7.552
43.8%
1 ene 1986 año
17.986
-6.808
-27.46%
1 ene 1987 año
11.724
-6.261
-34.81%
1 ene 1988 año
10.684
-1.04
-8.87%
1 ene 1989 año
6.987
-3.697
-34.6%
1 ene 1990 año
7.072
+0.085
1.22%
1 ene 1991 año
9.828
+2.756
38.97%
1 ene 1992 año
12.238
+2.409
24.51%
1 ene 1993 año
10.047
-2.19
-17.9%
1 ene 1994 año
5.469
-4.578
-45.56%
1 ene 1995 año
5.109
-0.36
-6.58%
1 ene 1996 año
3.301
-1.809
-35.4%
1 ene 1997 año
3.852
+0.552
16.71%
1 ene 1998 año
3.671
-0.181
-4.7%
1 ene 1999 año
3.167
-0.504
-13.72%
1 ene 2000 año
8.55
+5.383
169.95%
1 ene 2001 año
2.182
-6.368
-74.48%
1 ene 2002 año
8.554
+6.372
291.99%
1 ene 2003 año
6.515
-2.038
-23.83%
1 ene 2004 año
7.942
+1.427
21.9%
1 ene 2005 año
3.619
-4.323
-54.43%
1 ene 2006 año
19.241
+15.623
431.7%
1 ene 2007 año
36.512
+17.271
89.76%
1 ene 2008 año
31.859
-4.653
-12.74%
1 ene 2009 año
14.227
-17.633
-55.35%
1 ene 2010 año
23.34
+9.113
64.06%
1 ene 2011 año
35.022
+11.682
50.05%
1 ene 2012 año
17.188
-17.833
-50.92%
1 ene 2013 año
22.969
+5.78
33.63%
1 ene 2014 año
23.493
+0.524
2.28%
1 ene 2015 año
18.938
-4.555
-19.39%
1 ene 2016 año
25.195
+6.257
33.04%
Ranking de los países por los datos estadísticos actuales


Comentarios: