29
/es/
es
AIzaSyAYiBZKx7MnpbEhh9jyipgxe19OcubqV5w
April 1, 2024
268816
Tunisia
TUN
true
2
1
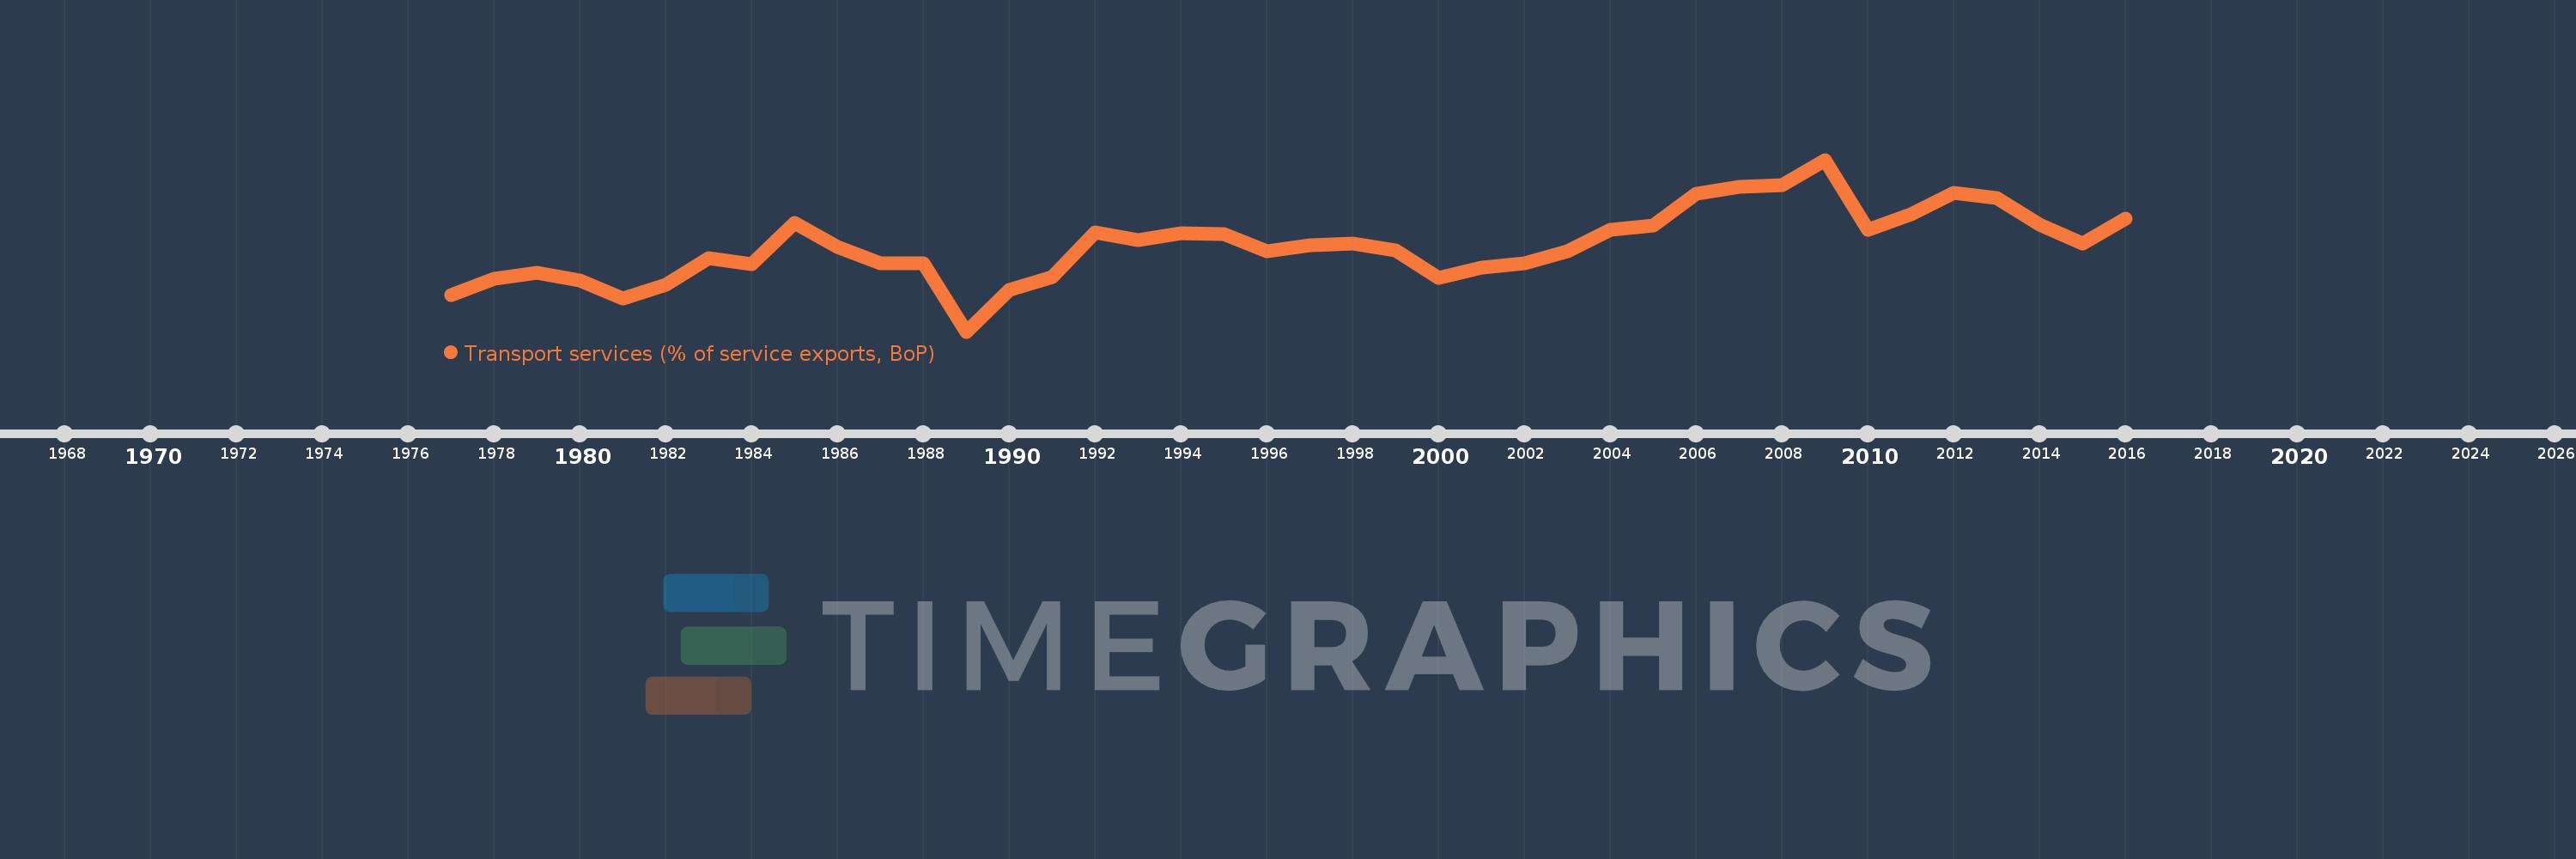
Transport services (% of service exports, BoP)
2016,2015,2014,2013,2012,2011,2010,2009,2008,2007,2006,2005,2004,2003,2002,2001,2000,1999,1998,1997,1996,1995,1994,1993,1992,1991,1990,1989,1988,1987,1986,1985,1984,1983,1982,1981,1980,1979,1978,1977
Estas estadísticas en otros países:
AfghanistanAlbaniaAlgeriaAngolaAntigua and BarbudaArab WorldArgentinaArmeniaArubaAustraliaAustriaAzerbaijanBahamas, TheBahrainBangladeshBarbadosBelarusBelgiumBelizeBeninBermudaBhutanBoliviaBosnia and HerzegovinaBotswanaBrazilBrunei DarussalamBulgariaBurkina FasoBurundiCabo VerdeCambodiaCameroonCanadaCaribbean small statesCentral African RepublicCentral Europe and the BalticsChadChileChinaColombiaComorosCongo, Dem. Rep.Congo, Rep.Costa RicaCote d'IvoireCroatiaCuracaoCyprusCzech RepublicDenmarkDjiboutiDominicaDominican RepublicEarly-demographic dividendEast Asia & PacificEast Asia & Pacific (excluding high income)East Asia & Pacific (IDA & IBRD countries)EcuadorEgypt, Arab Rep.El SalvadorEritreaEstoniaEthiopiaEuro areaEurope & Central AsiaEurope & Central Asia (excluding high income)Europe & Central Asia (IDA & IBRD countries)European UnionFaroe IslandsFijiFinlandFragile and conflict affected situationsFranceFrench PolynesiaGabonGambia, TheGeorgiaGermanyGhanaGreeceGrenadaGuatemalaGuineaGuinea-BissauGuyanaHaitiHeavily indebted poor countries (HIPC)High incomeHondurasHong Kong SAR, ChinaHungaryIBRD onlyIcelandIDA & IBRD totalIDA onlyIDA totalIndiaIndonesiaIran, Islamic Rep.IraqIrelandIsraelItalyJamaicaJapanJordanKazakhstanKenyaKiribatiKorea, Rep.KosovoKuwaitKyrgyz RepublicLao PDRLate-demographic dividendLatin America & Caribbean Latin America & Caribbean (excluding high income)Latin America & the Caribbean (IDA & IBRD countries)LatviaLeast developed countries: UN classificationLebanonLesothoLiberiaLibyaLithuaniaLow & middle incomeLow incomeLower middle incomeLuxembourgMacao SAR, ChinaMacedonia, FYRMadagascarMalawiMalaysiaMaldivesMaliMaltaMarshall IslandsMauritaniaMauritiusMexicoMicronesia, Fed. Sts.Middle East & North AfricaMiddle East & North Africa (excluding high income)Middle East & North Africa (IDA & IBRD countries)Middle incomeMoldovaMongoliaMontenegroMoroccoMozambiqueMyanmarNamibiaNepalNetherlandsNew CaledoniaNew ZealandNicaraguaNigerNigeriaNorth AmericaNorwayOECD membersOmanOther small statesPacific island small statesPakistanPalauPanamaPapua New GuineaParaguayPeruPhilippinesPolandPortugalPost-demographic dividendPre-demographic dividendQatarRomaniaRussian FederationRwandaSamoaSao Tome and PrincipeSaudi ArabiaSenegalSerbiaSeychellesSierra LeoneSingaporeSint Maarten (Dutch part)Slovak RepublicSloveniaSmall statesSolomon IslandsSouth AfricaSouth AsiaSouth Asia (IDA & IBRD)South SudanSpainSri LankaSt. Kitts and NevisSt. LuciaSt. Vincent and the GrenadinesSub-Saharan Africa Sub-Saharan Africa (excluding high income)Sub-Saharan Africa (IDA & IBRD countries)SudanSurinameSwazilandSwedenSwitzerlandSyrian Arab RepublicTajikistanTanzaniaThailandTimor-LesteTogoTongaTrinidad and TobagoTunisiaTurkeyTuvaluUgandaUkraineUnited KingdomUnited StatesUpper middle incomeUruguayVanuatuVenezuela, RBWest Bank and GazaWorldYemen, Rep.ZambiaZimbabwe línea de tiempo (timeline):
En esta escala de tiempo se presenta un gráfico de 1977 y 2016 de Tunisia. Los datos de 1976 están ausentes. El número de observaciones reales por fecha: 40.
Fuente (nombre):
Indicadores del desarrollo mundial
Fuente (organización):
International Monetary Fund, Balance of Payments Statistics Yearbook and data files.
Categorías:
Economy & Growth, Trade
Se ha actualizado:
23 abr 2017 año
Los indicadores de los cambios de valor en los últimos años
Mínimo:
16.289
1 ene 1989 año
Máximo:
32.5
1 ene 2009 año
A la fecha de observación
Valor
Cambio absoluto
El cambio con respecto al valor anterior
1 ene 1977 año
19.729
+19.729
0.0%
1 ene 1978 año
21.255
+1.527
7.74%
1 ene 1979 año
21.824
+0.569
2.68%
1 ene 1980 año
21.084
-0.741
-3.39%
1 ene 1981 año
19.444
-1.639
-7.78%
1 ene 1982 año
20.692
+1.248
6.42%
1 ene 1983 año
23.192
+2.499
12.08%
1 ene 1984 año
22.614
-0.578
-2.49%
1 ene 1985 año
26.512
+3.898
17.24%
1 ene 1986 año
24.273
-2.239
-8.44%
1 ene 1987 año
22.703
-1.57
-6.47%
1 ene 1988 año
22.763
+0.059
0.26%
1 ene 1989 año
16.289
-6.473
-28.44%
1 ene 1990 año
20.248
+3.958
24.3%
1 ene 1991 año
21.443
+1.195
5.9%
1 ene 1992 año
25.613
+4.17
19.45%
1 ene 1993 año
24.885
-0.728
-2.84%
1 ene 1994 año
25.537
+0.652
2.62%
1 ene 1995 año
25.469
-0.068
-0.27%
1 ene 1996 año
23.852
-1.617
-6.35%
1 ene 1997 año
24.395
+0.543
2.28%
1 ene 1998 año
24.637
+0.242
0.99%
1 ene 1999 año
23.917
-0.72
-2.92%
1 ene 2000 año
21.366
-2.55
-10.66%
1 ene 2001 año
22.366
+0.999
4.68%
1 ene 2002 año
22.706
+0.34
1.52%
1 ene 2003 año
23.849
+1.143
5.03%
1 ene 2004 año
25.92
+2.071
8.68%
1 ene 2005 año
26.299
+0.379
1.46%
1 ene 2006 año
29.301
+3.002
11.41%
1 ene 2007 año
29.941
+0.641
2.19%
1 ene 2008 año
30.101
+0.159
0.53%
1 ene 2009 año
32.5
+2.399
7.97%
1 ene 2010 año
25.912
-6.589
-20.27%
1 ene 2011 año
27.321
+1.409
5.44%
1 ene 2012 año
29.342
+2.021
7.4%
1 ene 2013 año
28.913
-0.429
-1.46%
1 ene 2014 año
26.368
-2.546
-8.8%
1 ene 2015 año
24.581
-1.787
-6.78%
1 ene 2016 año
26.926
+2.345
9.54%
Ranking de los países por los datos estadísticos actuales


Comentarios: