29
/es/
es
AIzaSyAYiBZKx7MnpbEhh9jyipgxe19OcubqV5w
April 1, 2024
58573
South Asia (IDA & IBRD)
TSA
false
2
1
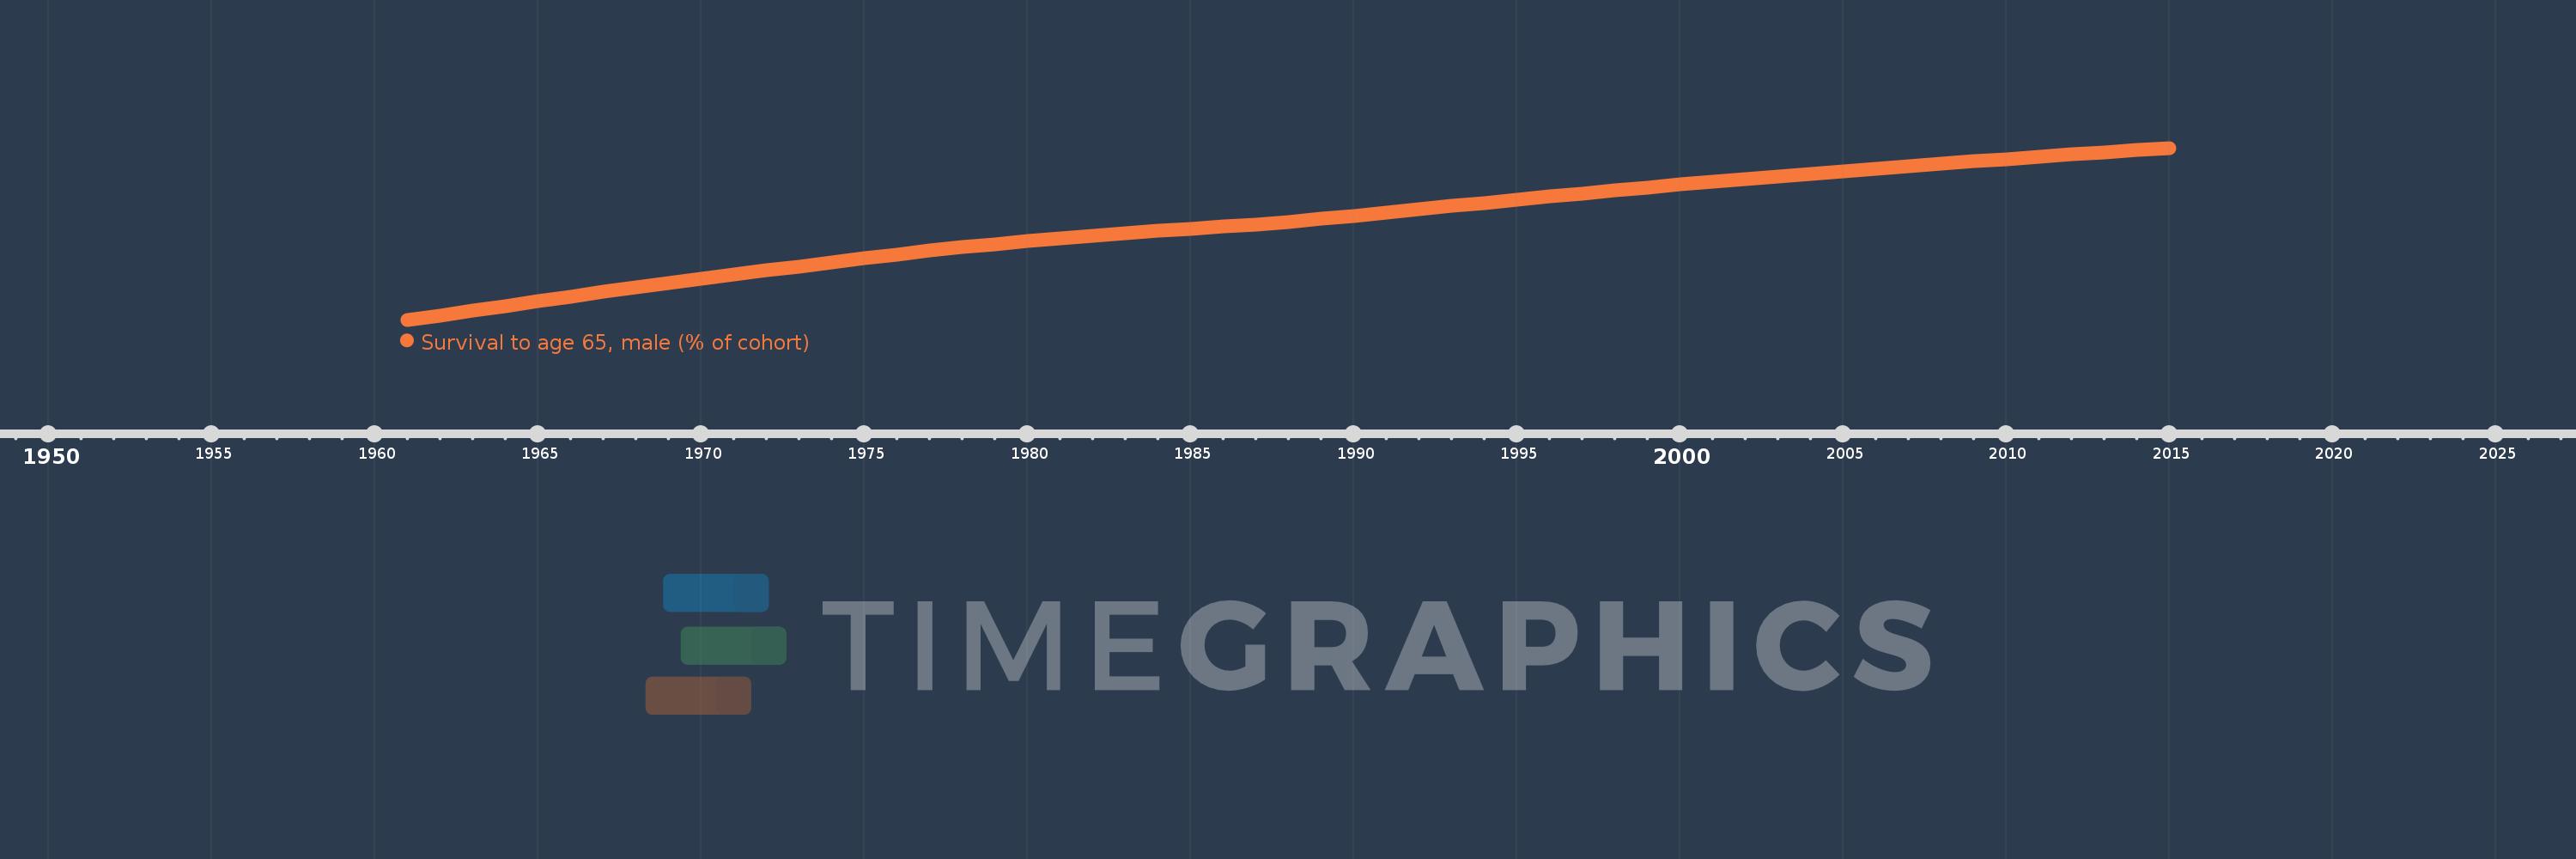
Survival to age 65, male (% of cohort)
2015,2014,2013,2012,2011,2010,2009,2008,2007,2006,2005,2004,2003,2002,2001,2000,1999,1998,1997,1996,1995,1994,1993,1992,1991,1990,1989,1988,1987,1986,1985,1984,1983,1982,1981,1980,1979,1978,1977,1976,1975,1974,1973,1972,1971,1970,1969,1968,1967,1966,1965,1964,1963,1962,1961
Estas estadísticas en otros países:
AfghanistanAlbaniaAlgeriaAngolaAntigua and BarbudaArab WorldArgentinaArmeniaArubaAustraliaAustriaAzerbaijanBahamas, TheBahrainBangladeshBarbadosBelarusBelgiumBelizeBeninBhutanBoliviaBosnia and HerzegovinaBotswanaBrazilBrunei DarussalamBulgariaBurkina FasoBurundiCabo VerdeCambodiaCameroonCanadaCaribbean small statesCentral African RepublicCentral Europe and the BalticsChadChannel IslandsChileChinaColombiaComorosCongo, Dem. Rep.Congo, Rep.Costa RicaCote d'IvoireCroatiaCubaCuracaoCyprusCzech RepublicDenmarkDjiboutiDominican RepublicEarly-demographic dividendEast Asia & PacificEast Asia & Pacific (excluding high income)East Asia & Pacific (IDA & IBRD countries)EcuadorEgypt, Arab Rep.El SalvadorEquatorial GuineaEritreaEstoniaEthiopiaEuro areaEurope & Central AsiaEurope & Central Asia (excluding high income)Europe & Central Asia (IDA & IBRD countries)European UnionFijiFinlandFragile and conflict affected situationsFranceFrench PolynesiaGabonGambia, TheGeorgiaGermanyGhanaGreeceGrenadaGuamGuatemalaGuineaGuinea-BissauGuyanaHaitiHeavily indebted poor countries (HIPC)High incomeHondurasHong Kong SAR, ChinaHungaryIBRD onlyIcelandIDA & IBRD totalIDA blendIDA onlyIDA totalIndiaIndonesiaIran, Islamic Rep.IraqIrelandIsraelItalyJamaicaJapanJordanKazakhstanKenyaKiribatiKorea, Dem. People’s Rep.Korea, Rep.KuwaitKyrgyz RepublicLao PDRLate-demographic dividendLatin America & Caribbean Latin America & Caribbean (excluding high income)Latin America & the Caribbean (IDA & IBRD countries)LatviaLeast developed countries: UN classificationLebanonLesothoLiberiaLibyaLithuaniaLow & middle incomeLow incomeLower middle incomeLuxembourgMacao SAR, ChinaMacedonia, FYRMadagascarMalawiMalaysiaMaldivesMaliMaltaMauritaniaMauritiusMexicoMicronesia, Fed. Sts.Middle East & North AfricaMiddle East & North Africa (excluding high income)Middle East & North Africa (IDA & IBRD countries)Middle incomeMoldovaMongoliaMontenegroMoroccoMozambiqueMyanmarNamibiaNepalNetherlandsNew CaledoniaNew ZealandNicaraguaNigerNigeriaNorth AmericaNorwayOECD membersOmanOther small statesPacific island small statesPakistanPanamaPapua New GuineaParaguayPeruPhilippinesPolandPortugalPost-demographic dividendPre-demographic dividendPuerto RicoQatarRomaniaRussian FederationRwandaSamoaSao Tome and PrincipeSaudi ArabiaSenegalSerbiaSeychellesSierra LeoneSingaporeSlovak RepublicSloveniaSmall statesSolomon IslandsSomaliaSouth AfricaSouth AsiaSouth Asia (IDA & IBRD)South SudanSpainSri LankaSt. LuciaSt. Vincent and the GrenadinesSub-Saharan Africa Sub-Saharan Africa (excluding high income)Sub-Saharan Africa (IDA & IBRD countries)SudanSurinameSwazilandSwedenSwitzerlandSyrian Arab RepublicTajikistanTanzaniaThailandTimor-LesteTogoTongaTrinidad and TobagoTunisiaTurkeyTurkmenistanUgandaUkraineUnited Arab EmiratesUnited KingdomUnited StatesUpper middle incomeUruguayUzbekistanVanuatuVenezuela, RBVietnamVirgin Islands (U.S.)West Bank and GazaWorldYemen, Rep.ZambiaZimbabwe línea de tiempo (timeline):
En esta escala de tiempo se presenta un gráfico de 1961 y 2015 de South Asia (IDA & IBRD). Los datos de 1960 están ausentes. El número de observaciones reales por fecha: 55.
Fuente (nombre):
Indicadores del desarrollo mundial
Fuente (organización):
United Nations Population Division. World Population Prospects. New York, United Nations, Department of Economic and Social Affairs (advanced Excel tables). Available at http://esa.un.org/wpp/unpp/panel_population.htm.
Categorías:
Health, Gender
Se ha actualizado:
23 abr 2017 año
Los indicadores de los cambios de valor en los últimos años
Mínimo:
31.598
1 ene 1961 año
Máximo:
66.743
1 ene 2015 año
A la fecha de observación
Valor
Cambio absoluto
El cambio con respecto al valor anterior
1 ene 1961 año
31.598
+31.598
0.0%
1 ene 1962 año
32.507
+0.909
2.88%
1 ene 1963 año
33.422
+0.915
2.81%
1 ene 1964 año
34.387
+0.965
2.89%
1 ene 1965 año
35.353
+0.966
2.81%
1 ene 1966 año
36.31
+0.957
2.71%
1 ene 1967 año
37.267
+0.957
2.64%
1 ene 1968 año
38.218
+0.95
2.55%
1 ene 1969 año
39.077
+0.86
2.25%
1 ene 1970 año
39.935
+0.858
2.2%
1 ene 1971 año
40.795
+0.86
2.15%
1 ene 1972 año
41.654
+0.859
2.11%
1 ene 1973 año
42.516
+0.862
2.07%
1 ene 1974 año
43.323
+0.807
1.9%
1 ene 1975 año
44.128
+0.805
1.86%
1 ene 1976 año
44.934
+0.806
1.83%
1 ene 1977 año
45.744
+0.811
1.8%
1 ene 1978 año
46.556
+0.812
1.77%
1 ene 1979 año
47.096
+0.54
1.16%
1 ene 1980 año
47.639
+0.543
1.15%
1 ene 1981 año
48.184
+0.545
1.14%
1 ene 1982 año
48.73
+0.546
1.13%
1 ene 1983 año
49.282
+0.552
1.13%
1 ene 1984 año
49.735
+0.453
0.92%
1 ene 1985 año
50.186
+0.451
0.91%
1 ene 1986 año
50.635
+0.449
0.89%
1 ene 1987 año
51.082
+0.447
0.88%
1 ene 1988 año
51.526
+0.444
0.87%
1 ene 1989 año
52.198
+0.673
1.31%
1 ene 1990 año
52.868
+0.67
1.28%
1 ene 1991 año
53.535
+0.668
1.26%
1 ene 1992 año
54.197
+0.662
1.24%
1 ene 1993 año
54.858
+0.66
1.22%
1 ene 1994 año
55.494
+0.636
1.16%
1 ene 1995 año
56.131
+0.637
1.15%
1 ene 1996 año
56.77
+0.639
1.14%
1 ene 1997 año
57.414
+0.644
1.13%
1 ene 1998 año
58.059
+0.645
1.12%
1 ene 1999 año
58.646
+0.587
1.01%
1 ene 2000 año
59.232
+0.586
1.0%
1 ene 2001 año
59.816
+0.584
0.99%
1 ene 2002 año
60.397
+0.581
0.97%
1 ene 2003 año
60.976
+0.579
0.96%
1 ene 2004 año
61.497
+0.521
0.85%
1 ene 2005 año
62.017
+0.52
0.85%
1 ene 2006 año
62.537
+0.52
0.84%
1 ene 2007 año
63.057
+0.52
0.83%
1 ene 2008 año
63.577
+0.52
0.82%
1 ene 2009 año
64.028
+0.452
0.71%
1 ene 2010 año
64.48
+0.452
0.71%
1 ene 2011 año
64.932
+0.452
0.7%
1 ene 2012 año
65.384
+0.452
0.7%
1 ene 2013 año
65.835
+0.452
0.69%
1 ene 2014 año
66.289
+0.454
0.69%
1 ene 2015 año
66.743
+0.454
0.69%
Ranking de los países por los datos estadísticos actuales


Comentarios: