29
/es/
es
AIzaSyAYiBZKx7MnpbEhh9jyipgxe19OcubqV5w
April 1, 2024
158983
Iraq
IRQ
true
2
1
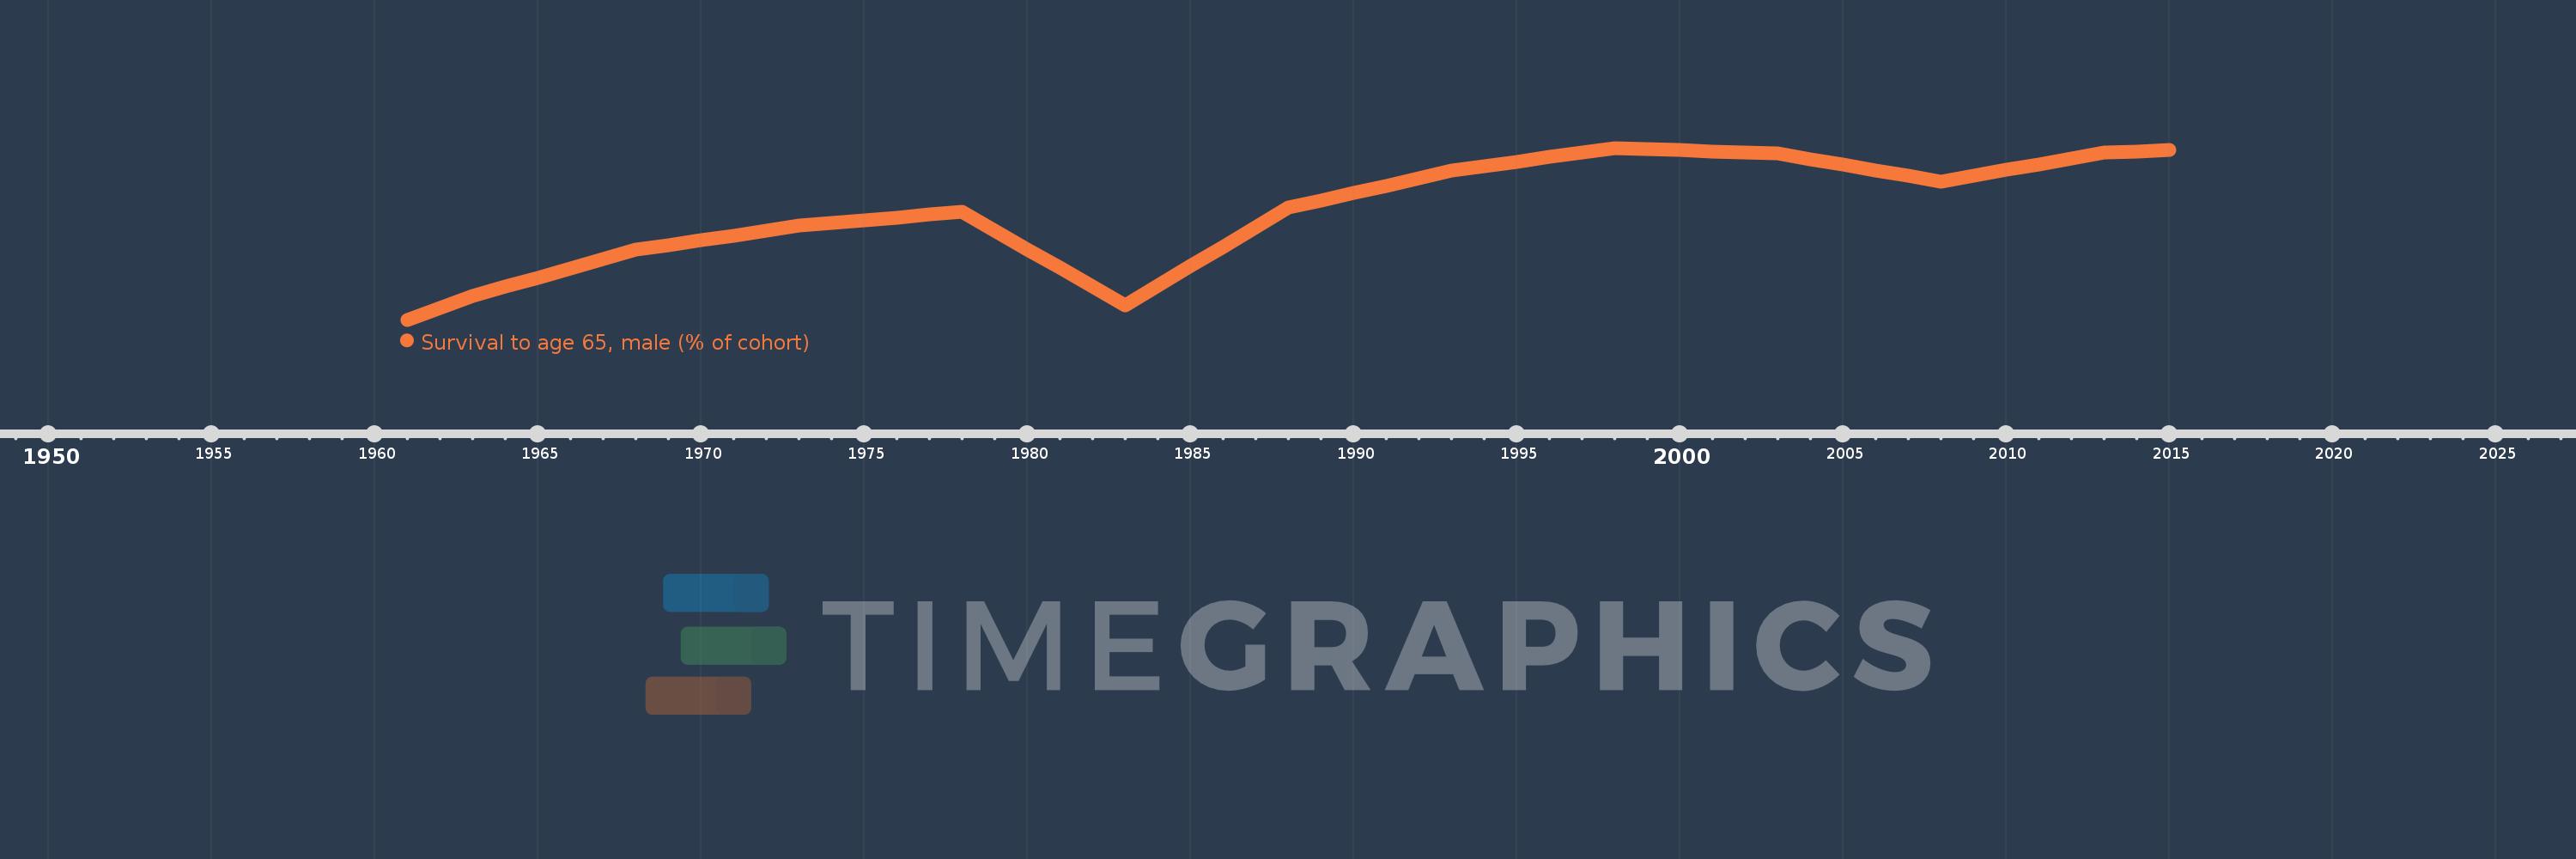
Survival to age 65, male (% of cohort)
2015,2014,2013,2012,2011,2010,2009,2008,2007,2006,2005,2004,2003,2002,2001,2000,1999,1998,1997,1996,1995,1994,1993,1992,1991,1990,1989,1988,1987,1986,1985,1984,1983,1982,1981,1980,1979,1978,1977,1976,1975,1974,1973,1972,1971,1970,1969,1968,1967,1966,1965,1964,1963,1962,1961
Estas estadísticas en otros países:
AfghanistanAlbaniaAlgeriaAngolaAntigua and BarbudaArab WorldArgentinaArmeniaArubaAustraliaAustriaAzerbaijanBahamas, TheBahrainBangladeshBarbadosBelarusBelgiumBelizeBeninBhutanBoliviaBosnia and HerzegovinaBotswanaBrazilBrunei DarussalamBulgariaBurkina FasoBurundiCabo VerdeCambodiaCameroonCanadaCaribbean small statesCentral African RepublicCentral Europe and the BalticsChadChannel IslandsChileChinaColombiaComorosCongo, Dem. Rep.Congo, Rep.Costa RicaCote d'IvoireCroatiaCubaCuracaoCyprusCzech RepublicDenmarkDjiboutiDominican RepublicEarly-demographic dividendEast Asia & PacificEast Asia & Pacific (excluding high income)East Asia & Pacific (IDA & IBRD countries)EcuadorEgypt, Arab Rep.El SalvadorEquatorial GuineaEritreaEstoniaEthiopiaEuro areaEurope & Central AsiaEurope & Central Asia (excluding high income)Europe & Central Asia (IDA & IBRD countries)European UnionFijiFinlandFragile and conflict affected situationsFranceFrench PolynesiaGabonGambia, TheGeorgiaGermanyGhanaGreeceGrenadaGuamGuatemalaGuineaGuinea-BissauGuyanaHaitiHeavily indebted poor countries (HIPC)High incomeHondurasHong Kong SAR, ChinaHungaryIBRD onlyIcelandIDA & IBRD totalIDA blendIDA onlyIDA totalIndiaIndonesiaIran, Islamic Rep.IraqIrelandIsraelItalyJamaicaJapanJordanKazakhstanKenyaKiribatiKorea, Dem. People’s Rep.Korea, Rep.KuwaitKyrgyz RepublicLao PDRLate-demographic dividendLatin America & Caribbean Latin America & Caribbean (excluding high income)Latin America & the Caribbean (IDA & IBRD countries)LatviaLeast developed countries: UN classificationLebanonLesothoLiberiaLibyaLithuaniaLow & middle incomeLow incomeLower middle incomeLuxembourgMacao SAR, ChinaMacedonia, FYRMadagascarMalawiMalaysiaMaldivesMaliMaltaMauritaniaMauritiusMexicoMicronesia, Fed. Sts.Middle East & North AfricaMiddle East & North Africa (excluding high income)Middle East & North Africa (IDA & IBRD countries)Middle incomeMoldovaMongoliaMontenegroMoroccoMozambiqueMyanmarNamibiaNepalNetherlandsNew CaledoniaNew ZealandNicaraguaNigerNigeriaNorth AmericaNorwayOECD membersOmanOther small statesPacific island small statesPakistanPanamaPapua New GuineaParaguayPeruPhilippinesPolandPortugalPost-demographic dividendPre-demographic dividendPuerto RicoQatarRomaniaRussian FederationRwandaSamoaSao Tome and PrincipeSaudi ArabiaSenegalSerbiaSeychellesSierra LeoneSingaporeSlovak RepublicSloveniaSmall statesSolomon IslandsSomaliaSouth AfricaSouth AsiaSouth Asia (IDA & IBRD)South SudanSpainSri LankaSt. LuciaSt. Vincent and the GrenadinesSub-Saharan Africa Sub-Saharan Africa (excluding high income)Sub-Saharan Africa (IDA & IBRD countries)SudanSurinameSwazilandSwedenSwitzerlandSyrian Arab RepublicTajikistanTanzaniaThailandTimor-LesteTogoTongaTrinidad and TobagoTunisiaTurkeyTurkmenistanUgandaUkraineUnited Arab EmiratesUnited KingdomUnited StatesUpper middle incomeUruguayUzbekistanVanuatuVenezuela, RBVietnamVirgin Islands (U.S.)West Bank and GazaWorldYemen, Rep.ZambiaZimbabwe línea de tiempo (timeline):
En esta escala de tiempo se presenta un gráfico de 1961 y 2015 de Iraq. Los datos de 1960 están ausentes. El número de observaciones reales por fecha: 55.
Fuente (nombre):
Indicadores del desarrollo mundial
Fuente (organización):
United Nations Population Division. World Population Prospects. New York, United Nations, Department of Economic and Social Affairs (advanced Excel tables). Available at http://esa.un.org/wpp/unpp/panel_population.htm.
Categorías:
Health, Gender
Se ha actualizado:
23 abr 2017 año
Los indicadores de los cambios de valor en los últimos años
Mínimo:
42.112
1 ene 1961 año
Máximo:
68.399
1 ene 1998 año
A la fecha de observación
Valor
Cambio absoluto
El cambio con respecto al valor anterior
1 ene 1961 año
42.112
+42.112
0.0%
1 ene 1962 año
43.915
+1.803
4.28%
1 ene 1963 año
45.718
+1.803
4.11%
1 ene 1964 año
47.139
+1.42
3.11%
1 ene 1965 año
48.559
+1.42
3.01%
1 ene 1966 año
49.98
+1.42
2.93%
1 ene 1967 año
51.4
+1.42
2.84%
1 ene 1968 año
52.82
+1.42
2.76%
1 ene 1969 año
53.552
+0.732
1.39%
1 ene 1970 año
54.284
+0.732
1.37%
1 ene 1971 año
55.016
+0.732
1.35%
1 ene 1972 año
55.747
+0.732
1.33%
1 ene 1973 año
56.479
+0.732
1.31%
1 ene 1974 año
56.903
+0.424
0.75%
1 ene 1975 año
57.327
+0.424
0.74%
1 ene 1976 año
57.751
+0.424
0.74%
1 ene 1977 año
58.174
+0.424
0.73%
1 ene 1978 año
58.598
+0.424
0.73%
1 ene 1979 año
55.747
-2.851
-4.87%
1 ene 1980 año
52.896
-2.851
-5.11%
1 ene 1981 año
50.045
-2.851
-5.39%
1 ene 1982 año
47.194
-2.851
-5.7%
1 ene 1983 año
44.344
-2.851
-6.04%
1 ene 1984 año
47.324
+2.981
6.72%
1 ene 1985 año
50.305
+2.981
6.3%
1 ene 1986 año
53.285
+2.981
5.92%
1 ene 1987 año
56.266
+2.981
5.59%
1 ene 1988 año
59.246
+2.981
5.3%
1 ene 1989 año
60.373
+1.127
1.9%
1 ene 1990 año
61.5
+1.127
1.87%
1 ene 1991 año
62.627
+1.127
1.83%
1 ene 1992 año
63.754
+1.127
1.8%
1 ene 1993 año
64.881
+1.127
1.77%
1 ene 1994 año
65.585
+0.704
1.08%
1 ene 1995 año
66.288
+0.704
1.07%
1 ene 1996 año
66.992
+0.703
1.06%
1 ene 1997 año
67.695
+0.704
1.05%
1 ene 1998 año
68.399
+0.704
1.04%
1 ene 1999 año
68.221
-0.178
-0.26%
1 ene 2000 año
68.043
-0.178
-0.26%
1 ene 2001 año
67.866
-0.178
-0.26%
1 ene 2002 año
67.688
-0.178
-0.26%
1 ene 2003 año
67.51
-0.178
-0.26%
1 ene 2004 año
66.665
-0.845
-1.25%
1 ene 2005 año
65.82
-0.845
-1.27%
1 ene 2006 año
64.975
-0.845
-1.28%
1 ene 2007 año
64.129
-0.845
-1.3%
1 ene 2008 año
63.284
-0.845
-1.32%
1 ene 2009 año
64.156
+0.872
1.38%
1 ene 2010 año
65.028
+0.872
1.36%
1 ene 2011 año
65.9
+0.872
1.34%
1 ene 2012 año
66.772
+0.872
1.32%
1 ene 2013 año
67.644
+0.872
1.31%
1 ene 2014 año
67.872
+0.228
0.34%
1 ene 2015 año
68.099
+0.228
0.34%
Ranking de los países por los datos estadísticos actuales


Comentarios: