29
/es/
es
AIzaSyAYiBZKx7MnpbEhh9jyipgxe19OcubqV5w
April 1, 2024
24543
Arab World
ARB
false
2
1
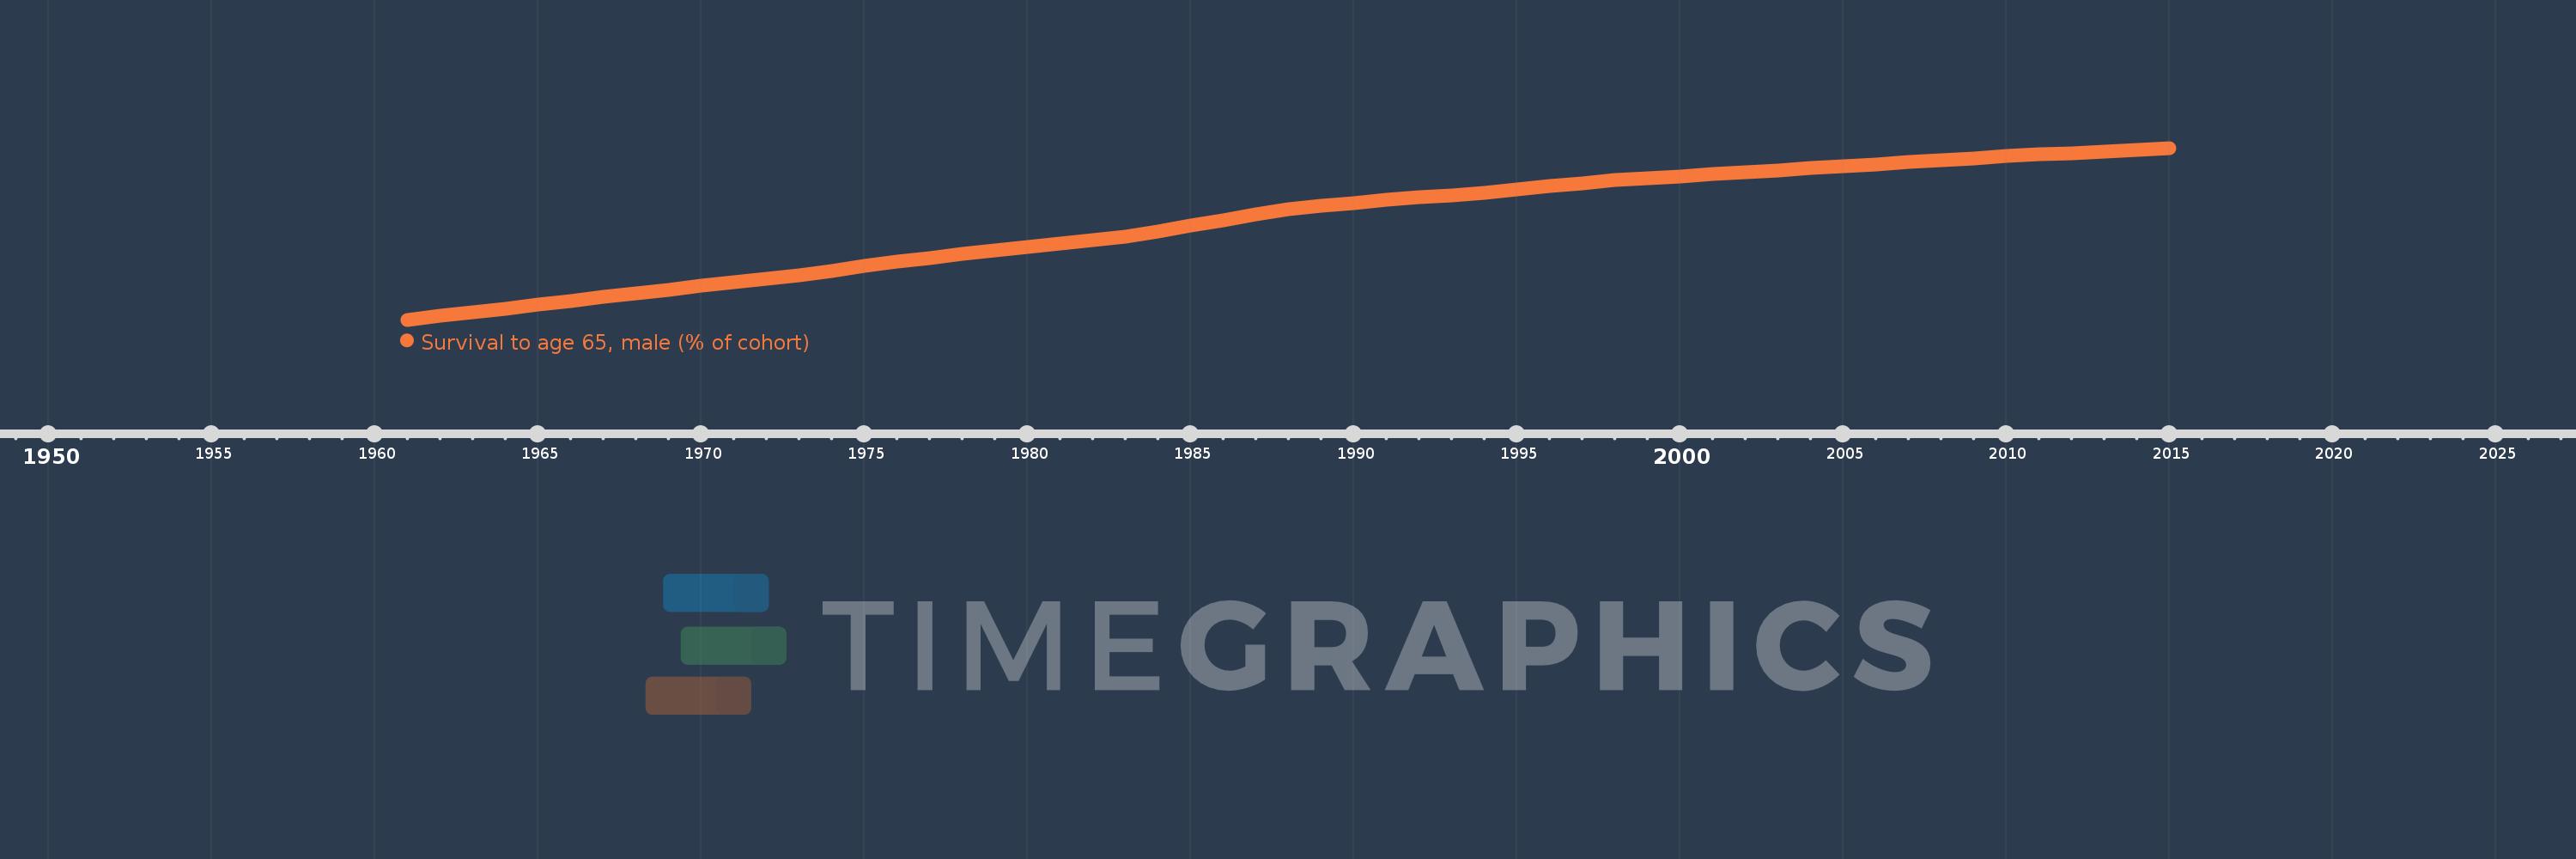
Survival to age 65, male (% of cohort)
2015,2014,2013,2012,2011,2010,2009,2008,2007,2006,2005,2004,2003,2002,2001,2000,1999,1998,1997,1996,1995,1994,1993,1992,1991,1990,1989,1988,1987,1986,1985,1984,1983,1982,1981,1980,1979,1978,1977,1976,1975,1974,1973,1972,1971,1970,1969,1968,1967,1966,1965,1964,1963,1962,1961
Estas estadísticas en otros países:
AfghanistanAlbaniaAlgeriaAngolaAntigua and BarbudaArab WorldArgentinaArmeniaArubaAustraliaAustriaAzerbaijanBahamas, TheBahrainBangladeshBarbadosBelarusBelgiumBelizeBeninBhutanBoliviaBosnia and HerzegovinaBotswanaBrazilBrunei DarussalamBulgariaBurkina FasoBurundiCabo VerdeCambodiaCameroonCanadaCaribbean small statesCentral African RepublicCentral Europe and the BalticsChadChannel IslandsChileChinaColombiaComorosCongo, Dem. Rep.Congo, Rep.Costa RicaCote d'IvoireCroatiaCubaCuracaoCyprusCzech RepublicDenmarkDjiboutiDominican RepublicEarly-demographic dividendEast Asia & PacificEast Asia & Pacific (excluding high income)East Asia & Pacific (IDA & IBRD countries)EcuadorEgypt, Arab Rep.El SalvadorEquatorial GuineaEritreaEstoniaEthiopiaEuro areaEurope & Central AsiaEurope & Central Asia (excluding high income)Europe & Central Asia (IDA & IBRD countries)European UnionFijiFinlandFragile and conflict affected situationsFranceFrench PolynesiaGabonGambia, TheGeorgiaGermanyGhanaGreeceGrenadaGuamGuatemalaGuineaGuinea-BissauGuyanaHaitiHeavily indebted poor countries (HIPC)High incomeHondurasHong Kong SAR, ChinaHungaryIBRD onlyIcelandIDA & IBRD totalIDA blendIDA onlyIDA totalIndiaIndonesiaIran, Islamic Rep.IraqIrelandIsraelItalyJamaicaJapanJordanKazakhstanKenyaKiribatiKorea, Dem. People’s Rep.Korea, Rep.KuwaitKyrgyz RepublicLao PDRLate-demographic dividendLatin America & Caribbean Latin America & Caribbean (excluding high income)Latin America & the Caribbean (IDA & IBRD countries)LatviaLeast developed countries: UN classificationLebanonLesothoLiberiaLibyaLithuaniaLow & middle incomeLow incomeLower middle incomeLuxembourgMacao SAR, ChinaMacedonia, FYRMadagascarMalawiMalaysiaMaldivesMaliMaltaMauritaniaMauritiusMexicoMicronesia, Fed. Sts.Middle East & North AfricaMiddle East & North Africa (excluding high income)Middle East & North Africa (IDA & IBRD countries)Middle incomeMoldovaMongoliaMontenegroMoroccoMozambiqueMyanmarNamibiaNepalNetherlandsNew CaledoniaNew ZealandNicaraguaNigerNigeriaNorth AmericaNorwayOECD membersOmanOther small statesPacific island small statesPakistanPanamaPapua New GuineaParaguayPeruPhilippinesPolandPortugalPost-demographic dividendPre-demographic dividendPuerto RicoQatarRomaniaRussian FederationRwandaSamoaSao Tome and PrincipeSaudi ArabiaSenegalSerbiaSeychellesSierra LeoneSingaporeSlovak RepublicSloveniaSmall statesSolomon IslandsSomaliaSouth AfricaSouth AsiaSouth Asia (IDA & IBRD)South SudanSpainSri LankaSt. LuciaSt. Vincent and the GrenadinesSub-Saharan Africa Sub-Saharan Africa (excluding high income)Sub-Saharan Africa (IDA & IBRD countries)SudanSurinameSwazilandSwedenSwitzerlandSyrian Arab RepublicTajikistanTanzaniaThailandTimor-LesteTogoTongaTrinidad and TobagoTunisiaTurkeyTurkmenistanUgandaUkraineUnited Arab EmiratesUnited KingdomUnited StatesUpper middle incomeUruguayUzbekistanVanuatuVenezuela, RBVietnamVirgin Islands (U.S.)West Bank and GazaWorldYemen, Rep.ZambiaZimbabwe línea de tiempo (timeline):
En esta escala de tiempo se presenta un gráfico de 1961 y 2015 de Arab World. Los datos de 1960 están ausentes. El número de observaciones reales por fecha: 55.
Fuente (nombre):
Indicadores del desarrollo mundial
Fuente (organización):
United Nations Population Division. World Population Prospects. New York, United Nations, Department of Economic and Social Affairs (advanced Excel tables). Available at http://esa.un.org/wpp/unpp/panel_population.htm.
Categorías:
Health, Gender
Se ha actualizado:
23 abr 2017 año
Los indicadores de los cambios de valor en los últimos años
Mínimo:
39.519
1 ene 1961 año
Máximo:
72.264
1 ene 2015 año
A la fecha de observación
Valor
Cambio absoluto
El cambio con respecto al valor anterior
1 ene 1961 año
39.519
+39.519
0.0%
1 ene 1962 año
40.237
+0.718
1.82%
1 ene 1963 año
40.956
+0.719
1.79%
1 ene 1964 año
41.678
+0.721
1.76%
1 ene 1965 año
42.402
+0.724
1.74%
1 ene 1966 año
43.13
+0.728
1.72%
1 ene 1967 año
43.859
+0.729
1.69%
1 ene 1968 año
44.59
+0.731
1.67%
1 ene 1969 año
45.266
+0.676
1.52%
1 ene 1970 año
45.945
+0.679
1.5%
1 ene 1971 año
46.627
+0.681
1.48%
1 ene 1972 año
47.322
+0.695
1.49%
1 ene 1973 año
48.02
+0.699
1.48%
1 ene 1974 año
48.872
+0.851
1.77%
1 ene 1975 año
49.711
+0.84
1.72%
1 ene 1976 año
50.537
+0.825
1.66%
1 ene 1977 año
51.336
+0.8
1.58%
1 ene 1978 año
52.124
+0.787
1.53%
1 ene 1979 año
52.721
+0.597
1.15%
1 ene 1980 año
53.332
+0.611
1.16%
1 ene 1981 año
53.961
+0.63
1.18%
1 ene 1982 año
54.639
+0.678
1.26%
1 ene 1983 año
55.338
+0.699
1.28%
1 ene 1984 año
56.41
+1.072
1.94%
1 ene 1985 año
57.477
+1.068
1.89%
1 ene 1986 año
58.54
+1.063
1.85%
1 ene 1987 año
59.591
+1.051
1.79%
1 ene 1988 año
60.635
+1.044
1.75%
1 ene 1989 año
61.192
+0.558
0.92%
1 ene 1990 año
61.738
+0.545
0.89%
1 ene 1991 año
62.318
+0.58
0.94%
1 ene 1992 año
62.857
+0.539
0.86%
1 ene 1993 año
63.215
+0.358
0.57%
1 ene 1994 año
63.768
+0.554
0.88%
1 ene 1995 año
64.322
+0.553
0.87%
1 ene 1996 año
65.011
+0.689
1.07%
1 ene 1997 año
65.565
+0.554
0.85%
1 ene 1998 año
66.117
+0.553
0.84%
1 ene 1999 año
66.492
+0.375
0.57%
1 ene 2000 año
66.865
+0.373
0.56%
1 ene 2001 año
67.237
+0.372
0.56%
1 ene 2002 año
67.623
+0.386
0.57%
1 ene 2003 año
68.012
+0.389
0.58%
1 ene 2004 año
68.373
+0.361
0.53%
1 ene 2005 año
68.743
+0.37
0.54%
1 ene 2006 año
69.123
+0.38
0.55%
1 ene 2007 año
69.538
+0.415
0.6%
1 ene 2008 año
69.958
+0.42
0.6%
1 ene 2009 año
70.319
+0.361
0.52%
1 ene 2010 año
70.662
+0.344
0.49%
1 ene 2011 año
70.988
+0.326
0.46%
1 ene 2012 año
71.308
+0.319
0.45%
1 ene 2013 año
71.634
+0.327
0.46%
1 ene 2014 año
71.959
+0.324
0.45%
1 ene 2015 año
72.264
+0.305
0.42%
Ranking de los países por los datos estadísticos actuales


Comentarios: