29
/es/
es
AIzaSyAYiBZKx7MnpbEhh9jyipgxe19OcubqV5w
April 1, 2024
207474
Nepal
NPL
true
2
1
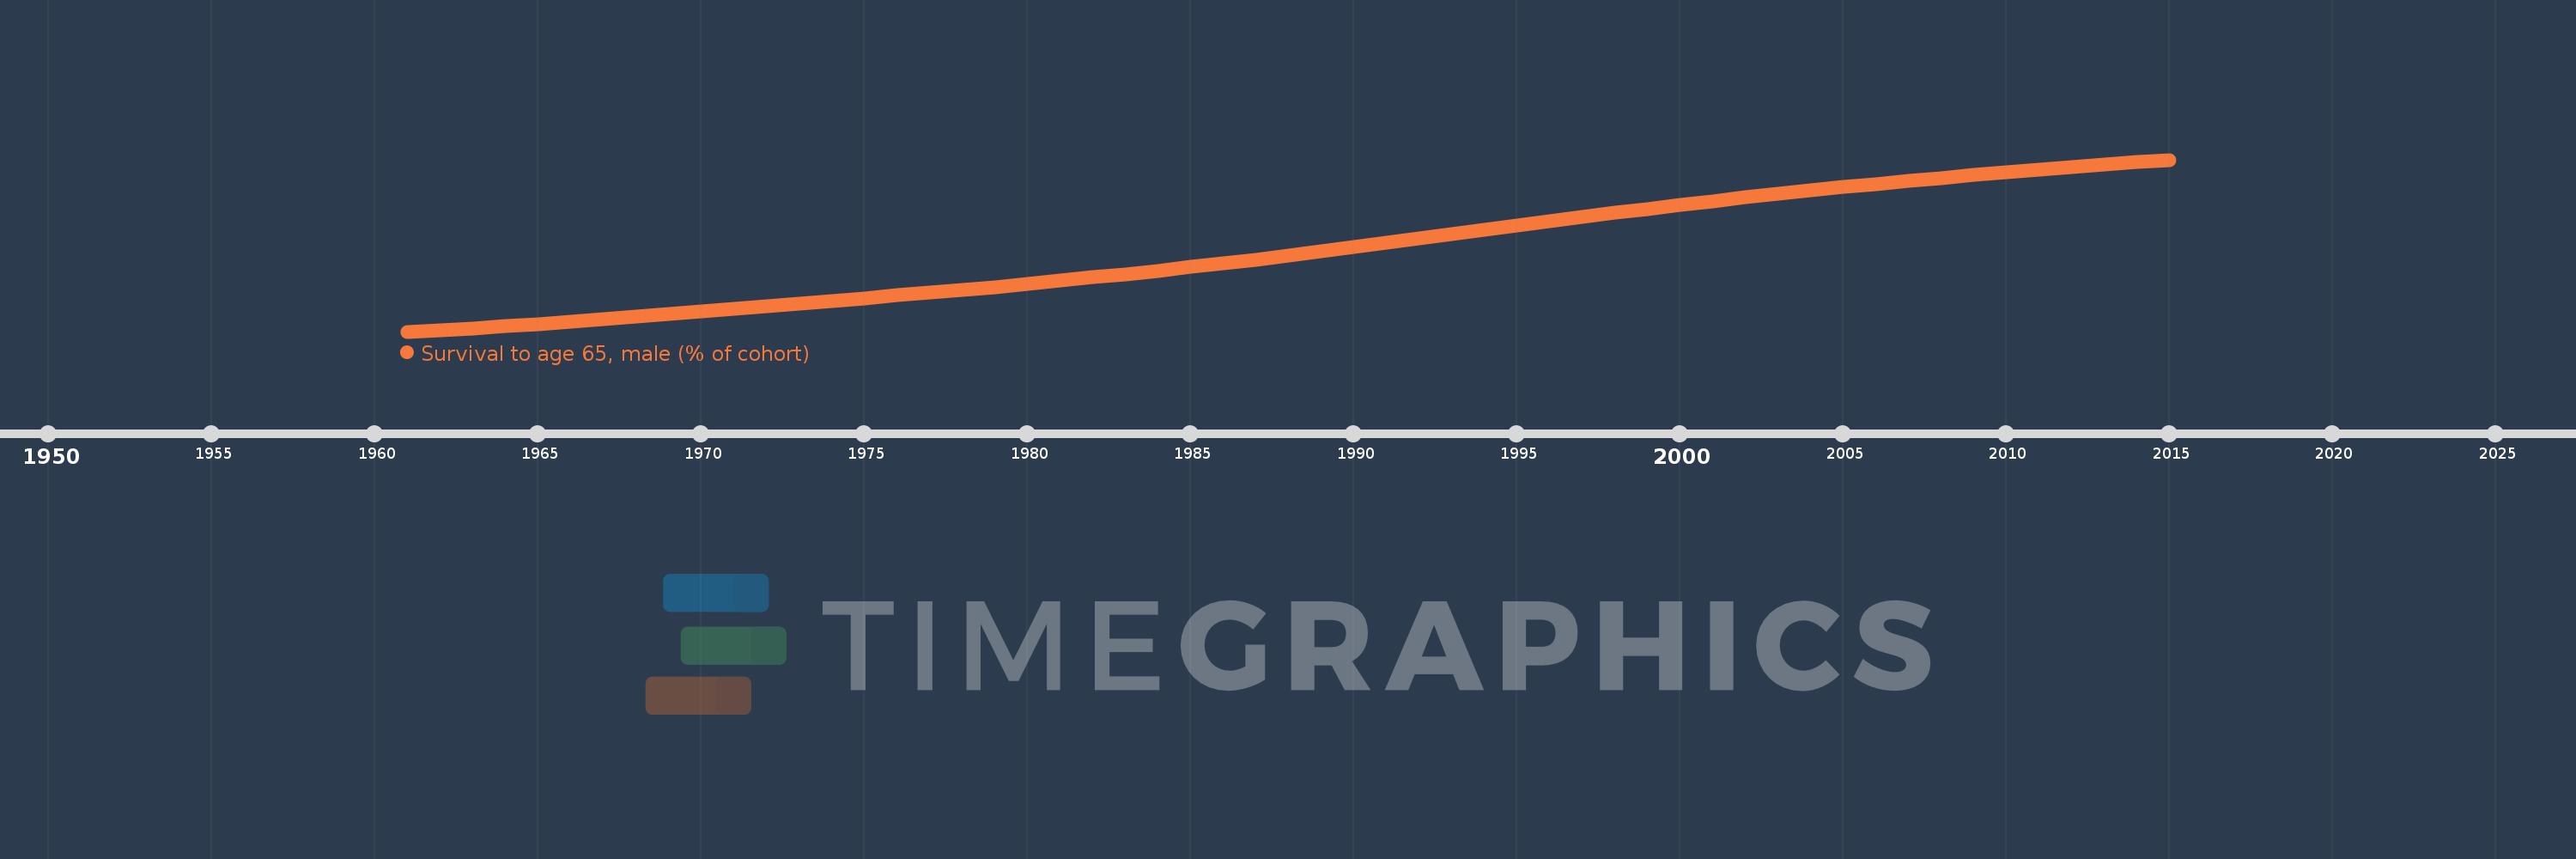
Survival to age 65, male (% of cohort)
2015,2014,2013,2012,2011,2010,2009,2008,2007,2006,2005,2004,2003,2002,2001,2000,1999,1998,1997,1996,1995,1994,1993,1992,1991,1990,1989,1988,1987,1986,1985,1984,1983,1982,1981,1980,1979,1978,1977,1976,1975,1974,1973,1972,1971,1970,1969,1968,1967,1966,1965,1964,1963,1962,1961
Estas estadísticas en otros países:
AfghanistanAlbaniaAlgeriaAngolaAntigua and BarbudaArab WorldArgentinaArmeniaArubaAustraliaAustriaAzerbaijanBahamas, TheBahrainBangladeshBarbadosBelarusBelgiumBelizeBeninBhutanBoliviaBosnia and HerzegovinaBotswanaBrazilBrunei DarussalamBulgariaBurkina FasoBurundiCabo VerdeCambodiaCameroonCanadaCaribbean small statesCentral African RepublicCentral Europe and the BalticsChadChannel IslandsChileChinaColombiaComorosCongo, Dem. Rep.Congo, Rep.Costa RicaCote d'IvoireCroatiaCubaCuracaoCyprusCzech RepublicDenmarkDjiboutiDominican RepublicEarly-demographic dividendEast Asia & PacificEast Asia & Pacific (excluding high income)East Asia & Pacific (IDA & IBRD countries)EcuadorEgypt, Arab Rep.El SalvadorEquatorial GuineaEritreaEstoniaEthiopiaEuro areaEurope & Central AsiaEurope & Central Asia (excluding high income)Europe & Central Asia (IDA & IBRD countries)European UnionFijiFinlandFragile and conflict affected situationsFranceFrench PolynesiaGabonGambia, TheGeorgiaGermanyGhanaGreeceGrenadaGuamGuatemalaGuineaGuinea-BissauGuyanaHaitiHeavily indebted poor countries (HIPC)High incomeHondurasHong Kong SAR, ChinaHungaryIBRD onlyIcelandIDA & IBRD totalIDA blendIDA onlyIDA totalIndiaIndonesiaIran, Islamic Rep.IraqIrelandIsraelItalyJamaicaJapanJordanKazakhstanKenyaKiribatiKorea, Dem. People’s Rep.Korea, Rep.KuwaitKyrgyz RepublicLao PDRLate-demographic dividendLatin America & Caribbean Latin America & Caribbean (excluding high income)Latin America & the Caribbean (IDA & IBRD countries)LatviaLeast developed countries: UN classificationLebanonLesothoLiberiaLibyaLithuaniaLow & middle incomeLow incomeLower middle incomeLuxembourgMacao SAR, ChinaMacedonia, FYRMadagascarMalawiMalaysiaMaldivesMaliMaltaMauritaniaMauritiusMexicoMicronesia, Fed. Sts.Middle East & North AfricaMiddle East & North Africa (excluding high income)Middle East & North Africa (IDA & IBRD countries)Middle incomeMoldovaMongoliaMontenegroMoroccoMozambiqueMyanmarNamibiaNepalNetherlandsNew CaledoniaNew ZealandNicaraguaNigerNigeriaNorth AmericaNorwayOECD membersOmanOther small statesPacific island small statesPakistanPanamaPapua New GuineaParaguayPeruPhilippinesPolandPortugalPost-demographic dividendPre-demographic dividendPuerto RicoQatarRomaniaRussian FederationRwandaSamoaSao Tome and PrincipeSaudi ArabiaSenegalSerbiaSeychellesSierra LeoneSingaporeSlovak RepublicSloveniaSmall statesSolomon IslandsSomaliaSouth AfricaSouth AsiaSouth Asia (IDA & IBRD)South SudanSpainSri LankaSt. LuciaSt. Vincent and the GrenadinesSub-Saharan Africa Sub-Saharan Africa (excluding high income)Sub-Saharan Africa (IDA & IBRD countries)SudanSurinameSwazilandSwedenSwitzerlandSyrian Arab RepublicTajikistanTanzaniaThailandTimor-LesteTogoTongaTrinidad and TobagoTunisiaTurkeyTurkmenistanUgandaUkraineUnited Arab EmiratesUnited KingdomUnited StatesUpper middle incomeUruguayUzbekistanVanuatuVenezuela, RBVietnamVirgin Islands (U.S.)West Bank and GazaWorldYemen, Rep.ZambiaZimbabwe línea de tiempo (timeline):
En esta escala de tiempo se presenta un gráfico de 1961 y 2015 de Nepal. Los datos de 1960 están ausentes. El número de observaciones reales por fecha: 55.
Fuente (nombre):
Indicadores del desarrollo mundial
Fuente (organización):
United Nations Population Division. World Population Prospects. New York, United Nations, Department of Economic and Social Affairs (advanced Excel tables). Available at http://esa.un.org/wpp/unpp/panel_population.htm.
Categorías:
Health, Gender
Se ha actualizado:
23 abr 2017 año
Los indicadores de los cambios de valor en los últimos años
Mínimo:
21.691
1 ene 1961 año
Máximo:
70.539
1 ene 2015 año
A la fecha de observación
Valor
Cambio absoluto
El cambio con respecto al valor anterior
1 ene 1961 año
21.691
+21.691
0.0%
1 ene 1962 año
22.078
+0.387
1.78%
1 ene 1963 año
22.465
+0.387
1.75%
1 ene 1964 año
23.159
+0.695
3.09%
1 ene 1965 año
23.854
+0.695
3.0%
1 ene 1966 año
24.549
+0.695
2.91%
1 ene 1967 año
25.244
+0.695
2.83%
1 ene 1968 año
25.939
+0.695
2.75%
1 ene 1969 año
26.681
+0.742
2.86%
1 ene 1970 año
27.422
+0.742
2.78%
1 ene 1971 año
28.164
+0.742
2.7%
1 ene 1972 año
28.906
+0.742
2.63%
1 ene 1973 año
29.648
+0.742
2.57%
1 ene 1974 año
30.416
+0.769
2.59%
1 ene 1975 año
31.185
+0.769
2.53%
1 ene 1976 año
31.954
+0.769
2.47%
1 ene 1977 año
32.723
+0.769
2.41%
1 ene 1978 año
33.492
+0.769
2.35%
1 ene 1979 año
34.39
+0.898
2.68%
1 ene 1980 año
35.289
+0.898
2.61%
1 ene 1981 año
36.187
+0.898
2.55%
1 ene 1982 año
37.086
+0.898
2.48%
1 ene 1983 año
37.984
+0.898
2.42%
1 ene 1984 año
39.032
+1.048
2.76%
1 ene 1985 año
40.08
+1.048
2.69%
1 ene 1986 año
41.128
+1.048
2.61%
1 ene 1987 año
42.176
+1.048
2.55%
1 ene 1988 año
43.224
+1.048
2.48%
1 ene 1989 año
44.453
+1.229
2.84%
1 ene 1990 año
45.682
+1.229
2.77%
1 ene 1991 año
46.912
+1.229
2.69%
1 ene 1992 año
48.141
+1.229
2.62%
1 ene 1993 año
49.37
+1.229
2.55%
1 ene 1994 año
50.585
+1.216
2.46%
1 ene 1995 año
51.801
+1.216
2.4%
1 ene 1996 año
53.017
+1.216
2.35%
1 ene 1997 año
54.232
+1.216
2.29%
1 ene 1998 año
55.448
+1.216
2.24%
1 ene 1999 año
56.553
+1.106
1.99%
1 ene 2000 año
57.659
+1.106
1.95%
1 ene 2001 año
58.765
+1.106
1.92%
1 ene 2002 año
59.87
+1.106
1.88%
1 ene 2003 año
60.976
+1.106
1.85%
1 ene 2004 año
61.861
+0.885
1.45%
1 ene 2005 año
62.746
+0.885
1.43%
1 ene 2006 año
63.631
+0.885
1.41%
1 ene 2007 año
64.516
+0.885
1.39%
1 ene 2008 año
65.401
+0.885
1.37%
1 ene 2009 año
66.171
+0.769
1.18%
1 ene 2010 año
66.94
+0.769
1.16%
1 ene 2011 año
67.709
+0.769
1.15%
1 ene 2012 año
68.478
+0.769
1.14%
1 ene 2013 año
69.247
+0.769
1.12%
1 ene 2014 año
69.893
+0.646
0.93%
1 ene 2015 año
70.539
+0.646
0.92%
Ranking de los países por los datos estadísticos actuales


Comentarios: