29
/es/
es
AIzaSyAYiBZKx7MnpbEhh9jyipgxe19OcubqV5w
April 1, 2024
40368
IDA total
IDA
false
2
1
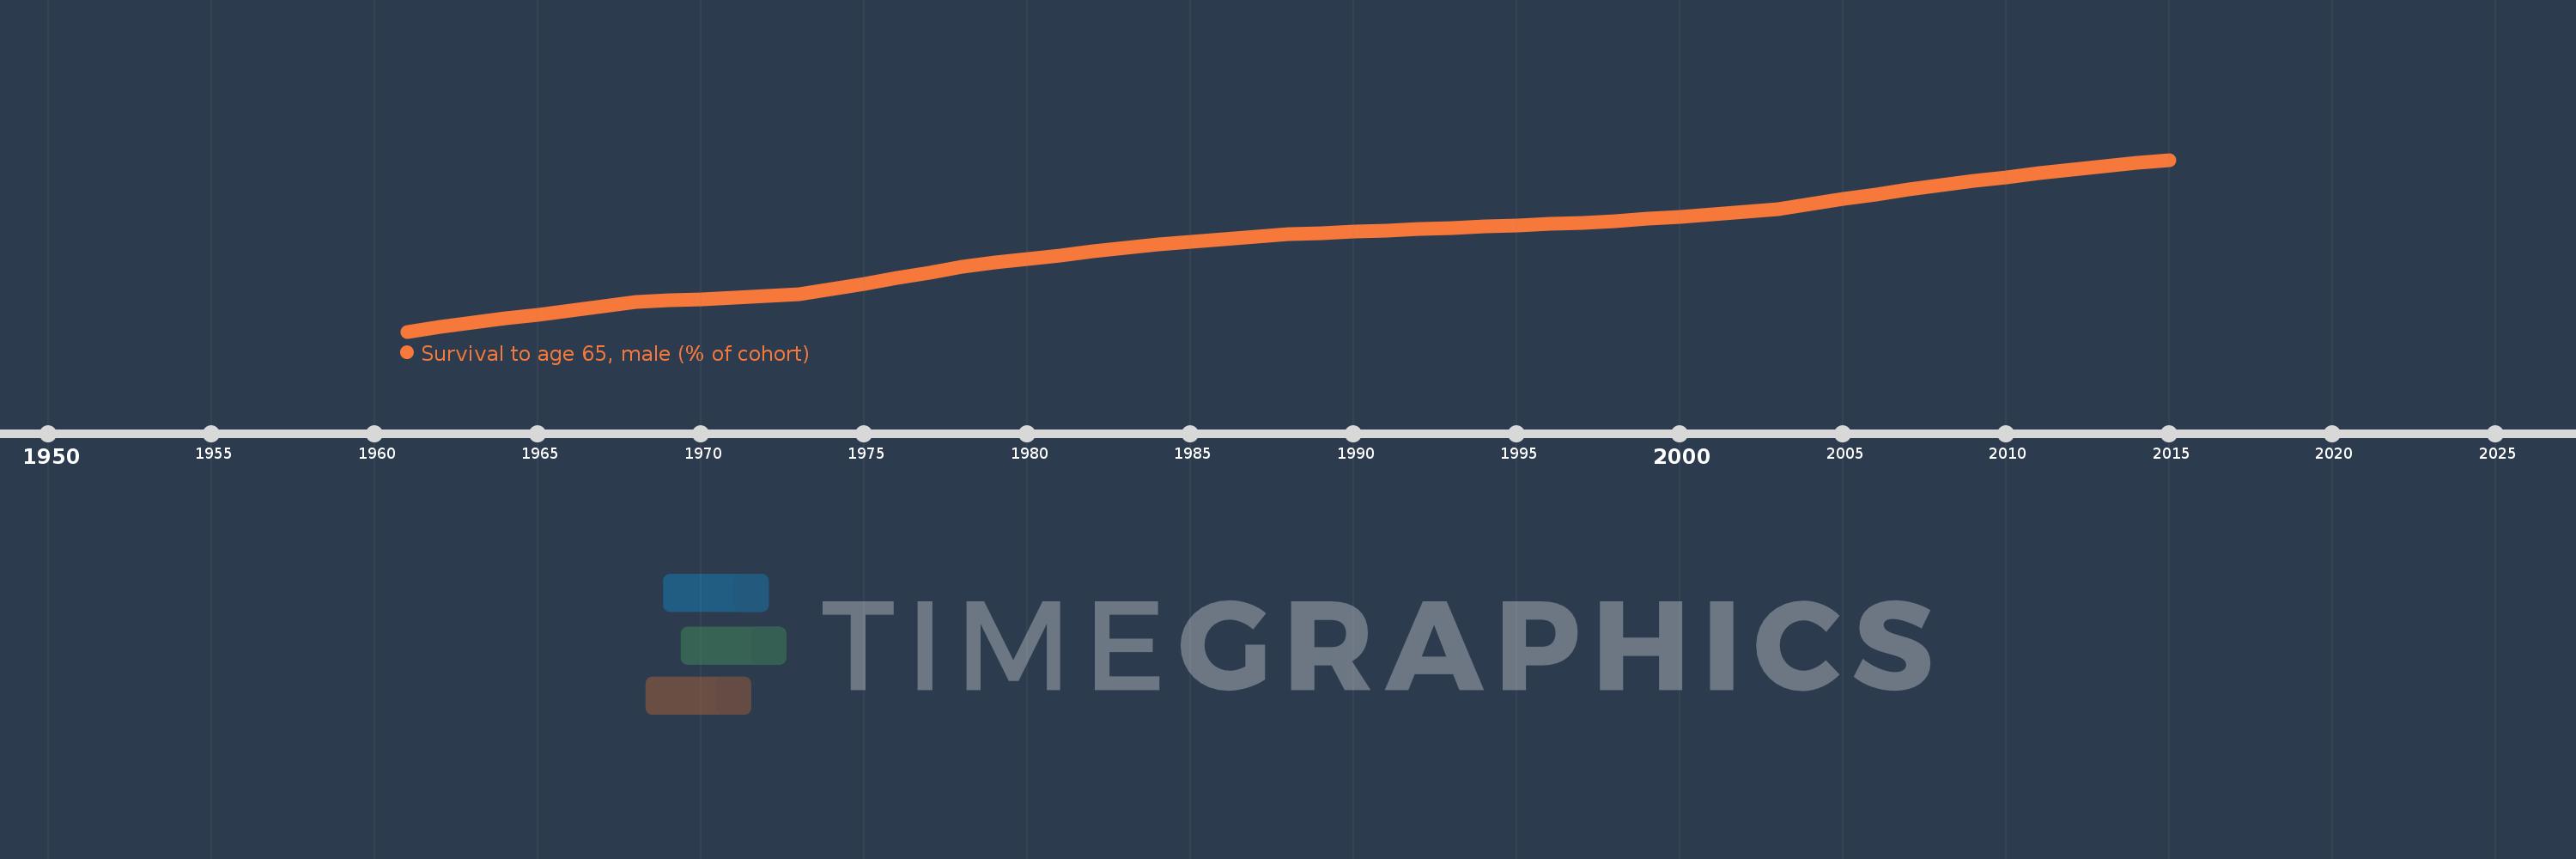
Survival to age 65, male (% of cohort)
2015,2014,2013,2012,2011,2010,2009,2008,2007,2006,2005,2004,2003,2002,2001,2000,1999,1998,1997,1996,1995,1994,1993,1992,1991,1990,1989,1988,1987,1986,1985,1984,1983,1982,1981,1980,1979,1978,1977,1976,1975,1974,1973,1972,1971,1970,1969,1968,1967,1966,1965,1964,1963,1962,1961
Estas estadísticas en otros países:
AfghanistanAlbaniaAlgeriaAngolaAntigua and BarbudaArab WorldArgentinaArmeniaArubaAustraliaAustriaAzerbaijanBahamas, TheBahrainBangladeshBarbadosBelarusBelgiumBelizeBeninBhutanBoliviaBosnia and HerzegovinaBotswanaBrazilBrunei DarussalamBulgariaBurkina FasoBurundiCabo VerdeCambodiaCameroonCanadaCaribbean small statesCentral African RepublicCentral Europe and the BalticsChadChannel IslandsChileChinaColombiaComorosCongo, Dem. Rep.Congo, Rep.Costa RicaCote d'IvoireCroatiaCubaCuracaoCyprusCzech RepublicDenmarkDjiboutiDominican RepublicEarly-demographic dividendEast Asia & PacificEast Asia & Pacific (excluding high income)East Asia & Pacific (IDA & IBRD countries)EcuadorEgypt, Arab Rep.El SalvadorEquatorial GuineaEritreaEstoniaEthiopiaEuro areaEurope & Central AsiaEurope & Central Asia (excluding high income)Europe & Central Asia (IDA & IBRD countries)European UnionFijiFinlandFragile and conflict affected situationsFranceFrench PolynesiaGabonGambia, TheGeorgiaGermanyGhanaGreeceGrenadaGuamGuatemalaGuineaGuinea-BissauGuyanaHaitiHeavily indebted poor countries (HIPC)High incomeHondurasHong Kong SAR, ChinaHungaryIBRD onlyIcelandIDA & IBRD totalIDA blendIDA onlyIDA totalIndiaIndonesiaIran, Islamic Rep.IraqIrelandIsraelItalyJamaicaJapanJordanKazakhstanKenyaKiribatiKorea, Dem. People’s Rep.Korea, Rep.KuwaitKyrgyz RepublicLao PDRLate-demographic dividendLatin America & Caribbean Latin America & Caribbean (excluding high income)Latin America & the Caribbean (IDA & IBRD countries)LatviaLeast developed countries: UN classificationLebanonLesothoLiberiaLibyaLithuaniaLow & middle incomeLow incomeLower middle incomeLuxembourgMacao SAR, ChinaMacedonia, FYRMadagascarMalawiMalaysiaMaldivesMaliMaltaMauritaniaMauritiusMexicoMicronesia, Fed. Sts.Middle East & North AfricaMiddle East & North Africa (excluding high income)Middle East & North Africa (IDA & IBRD countries)Middle incomeMoldovaMongoliaMontenegroMoroccoMozambiqueMyanmarNamibiaNepalNetherlandsNew CaledoniaNew ZealandNicaraguaNigerNigeriaNorth AmericaNorwayOECD membersOmanOther small statesPacific island small statesPakistanPanamaPapua New GuineaParaguayPeruPhilippinesPolandPortugalPost-demographic dividendPre-demographic dividendPuerto RicoQatarRomaniaRussian FederationRwandaSamoaSao Tome and PrincipeSaudi ArabiaSenegalSerbiaSeychellesSierra LeoneSingaporeSlovak RepublicSloveniaSmall statesSolomon IslandsSomaliaSouth AfricaSouth AsiaSouth Asia (IDA & IBRD)South SudanSpainSri LankaSt. LuciaSt. Vincent and the GrenadinesSub-Saharan Africa Sub-Saharan Africa (excluding high income)Sub-Saharan Africa (IDA & IBRD countries)SudanSurinameSwazilandSwedenSwitzerlandSyrian Arab RepublicTajikistanTanzaniaThailandTimor-LesteTogoTongaTrinidad and TobagoTunisiaTurkeyTurkmenistanUgandaUkraineUnited Arab EmiratesUnited KingdomUnited StatesUpper middle incomeUruguayUzbekistanVanuatuVenezuela, RBVietnamVirgin Islands (U.S.)West Bank and GazaWorldYemen, Rep.ZambiaZimbabwe línea de tiempo (timeline):
En esta escala de tiempo se presenta un gráfico de 1961 y 2015 de IDA total. Los datos de 1960 están ausentes. El número de observaciones reales por fecha: 55.
Fuente (nombre):
Indicadores del desarrollo mundial
Fuente (organización):
United Nations Population Division. World Population Prospects. New York, United Nations, Department of Economic and Social Affairs (advanced Excel tables). Available at http://esa.un.org/wpp/unpp/panel_population.htm.
Categorías:
Health, Gender
Se ha actualizado:
23 abr 2017 año
Los indicadores de los cambios de valor en los últimos años
Mínimo:
33.73
1 ene 1961 año
Máximo:
60.248
1 ene 2015 año
A la fecha de observación
Valor
Cambio absoluto
El cambio con respecto al valor anterior
1 ene 1961 año
33.73
+33.73
0.0%
1 ene 1962 año
34.417
+0.687
2.04%
1 ene 1963 año
35.101
+0.684
1.99%
1 ene 1964 año
35.721
+0.62
1.77%
1 ene 1965 año
36.348
+0.627
1.76%
1 ene 1966 año
36.974
+0.626
1.72%
1 ene 1967 año
37.624
+0.651
1.76%
1 ene 1968 año
38.273
+0.649
1.72%
1 ene 1969 año
38.51
+0.237
0.62%
1 ene 1970 año
38.747
+0.237
0.62%
1 ene 1971 año
38.985
+0.238
0.61%
1 ene 1972 año
39.232
+0.246
0.63%
1 ene 1973 año
39.475
+0.243
0.62%
1 ene 1974 año
40.314
+0.839
2.13%
1 ene 1975 año
41.154
+0.839
2.08%
1 ene 1976 año
41.998
+0.845
2.05%
1 ene 1977 año
42.863
+0.864
2.06%
1 ene 1978 año
43.737
+0.874
2.04%
1 ene 1979 año
44.339
+0.602
1.38%
1 ene 1980 año
44.936
+0.597
1.35%
1 ene 1981 año
45.525
+0.589
1.31%
1 ene 1982 año
46.116
+0.591
1.3%
1 ene 1983 año
46.706
+0.59
1.28%
1 ene 1984 año
47.127
+0.42
0.9%
1 ene 1985 año
47.54
+0.413
0.88%
1 ene 1986 año
47.947
+0.407
0.86%
1 ene 1987 año
48.36
+0.413
0.86%
1 ene 1988 año
48.763
+0.403
0.83%
1 ene 1989 año
48.965
+0.203
0.42%
1 ene 1990 año
49.159
+0.194
0.4%
1 ene 1991 año
49.343
+0.184
0.37%
1 ene 1992 año
49.534
+0.191
0.39%
1 ene 1993 año
49.729
+0.195
0.39%
1 ene 1994 año
49.932
+0.203
0.41%
1 ene 1995 año
50.126
+0.193
0.39%
1 ene 1996 año
50.312
+0.186
0.37%
1 ene 1997 año
50.51
+0.198
0.39%
1 ene 1998 año
50.704
+0.194
0.38%
1 ene 1999 año
51.103
+0.398
0.79%
1 ene 2000 año
51.497
+0.394
0.77%
1 ene 2001 año
51.888
+0.391
0.76%
1 ene 2002 año
52.288
+0.4
0.77%
1 ene 2003 año
52.681
+0.393
0.75%
1 ene 2004 año
53.42
+0.739
1.4%
1 ene 2005 año
54.156
+0.737
1.38%
1 ene 2006 año
54.89
+0.733
1.35%
1 ene 2007 año
55.626
+0.736
1.34%
1 ene 2008 año
56.359
+0.733
1.32%
1 ene 2009 año
56.954
+0.595
1.06%
1 ene 2010 año
57.544
+0.589
1.04%
1 ene 2011 año
58.131
+0.587
1.02%
1 ene 2012 año
58.721
+0.59
1.01%
1 ene 2013 año
59.313
+0.593
1.01%
1 ene 2014 año
59.781
+0.468
0.79%
1 ene 2015 año
60.248
+0.467
0.78%
Ranking de los países por los datos estadísticos actuales


Comentarios: