29
/es/
es
AIzaSyAYiBZKx7MnpbEhh9jyipgxe19OcubqV5w
April 1, 2024
58431
South Asia (IDA & IBRD)
TSA
false
2
1
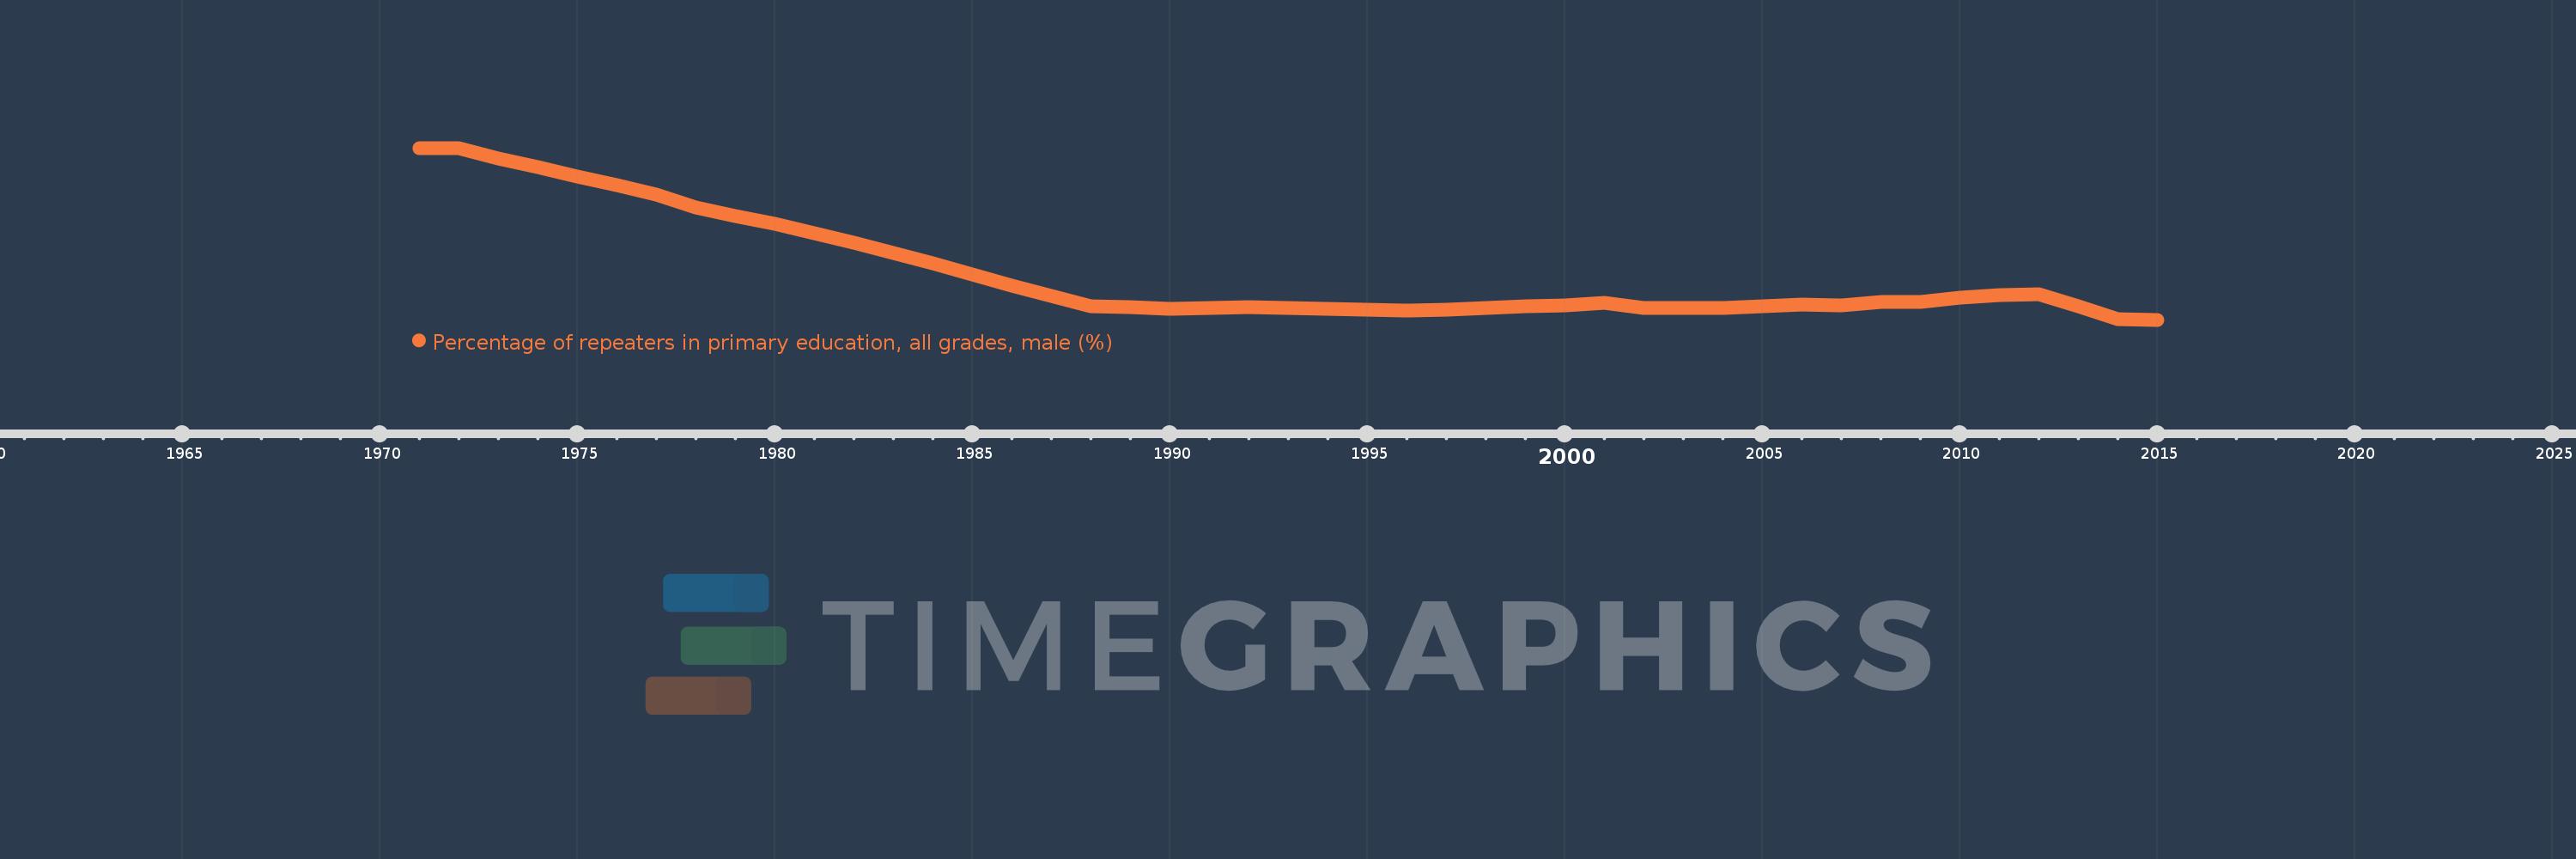
Percentage of repeaters in primary education, all grades, male (%)
2015,2014,2013,2012,2011,2010,2009,2008,2007,2006,2005,2004,2003,2002,2001,2000,1999,1998,1997,1996,1995,1994,1993,1992,1991,1990,1989,1988,1987,1986,1985,1984,1983,1982,1981,1980,1979,1978,1977,1976,1975,1974,1973,1972,1971
Estas estadísticas en otros países:
AfghanistanAlbaniaAlgeriaAndorraAngolaAntigua and BarbudaArab WorldArgentinaArmeniaArubaAustriaAzerbaijanBahamas, TheBahrainBangladeshBelarusBelgiumBelizeBeninBermudaBhutanBoliviaBosnia and HerzegovinaBotswanaBrazilBritish Virgin IslandsBrunei DarussalamBulgariaBurkina FasoBurundiCabo VerdeCambodiaCameroonCanadaCaribbean small statesCayman IslandsCentral African RepublicCentral Europe and the BalticsChadChileChinaColombiaComorosCongo, Dem. Rep.Congo, Rep.Costa RicaCote d'IvoireCroatiaCubaCyprusCzech RepublicDenmarkDjiboutiDominicaDominican RepublicEarly-demographic dividendEast Asia & PacificEast Asia & Pacific (excluding high income)East Asia & Pacific (IDA & IBRD countries)EcuadorEgypt, Arab Rep.El SalvadorEquatorial GuineaEritreaEstoniaEthiopiaEuro areaEurope & Central AsiaEurope & Central Asia (excluding high income)Europe & Central Asia (IDA & IBRD countries)European UnionFijiFinlandFragile and conflict affected situationsFranceGabonGambia, TheGeorgiaGermanyGhanaGreeceGrenadaGuatemalaGuineaGuinea-BissauGuyanaHaitiHeavily indebted poor countries (HIPC)High incomeHondurasHong Kong SAR, ChinaHungaryIBRD onlyIcelandIDA & IBRD totalIDA blendIDA onlyIDA totalIndiaIndonesiaIran, Islamic Rep.IraqIrelandIsraelItalyJamaicaJapanJordanKazakhstanKenyaKiribatiKorea, Rep.KuwaitKyrgyz RepublicLao PDRLate-demographic dividendLatin America & Caribbean Latin America & Caribbean (excluding high income)Latin America & the Caribbean (IDA & IBRD countries)LatviaLeast developed countries: UN classificationLebanonLesothoLiberiaLibyaLiechtensteinLithuaniaLow & middle incomeLow incomeLower middle incomeLuxembourgMacao SAR, ChinaMacedonia, FYRMadagascarMalawiMalaysiaMaldivesMaliMaltaMauritaniaMauritiusMexicoMiddle East & North AfricaMiddle East & North Africa (excluding high income)Middle East & North Africa (IDA & IBRD countries)Middle incomeMoldovaMonacoMongoliaMontenegroMoroccoMozambiqueMyanmarNamibiaNauruNepalNetherlandsNew ZealandNicaraguaNigerNorwayOECD membersOmanOther small statesPacific island small statesPakistanPalauPanamaPapua New GuineaParaguayPeruPhilippinesPolandPortugalPost-demographic dividendPre-demographic dividendQatarRomaniaRussian FederationRwandaSamoaSan MarinoSao Tome and PrincipeSaudi ArabiaSenegalSerbiaSeychellesSierra LeoneSingaporeSint Maarten (Dutch part)Slovak RepublicSloveniaSmall statesSolomon IslandsSomaliaSouth AfricaSouth AsiaSouth Asia (IDA & IBRD)South SudanSpainSri LankaSt. Kitts and NevisSt. LuciaSt. Vincent and the GrenadinesSub-Saharan Africa Sub-Saharan Africa (excluding high income)Sub-Saharan Africa (IDA & IBRD countries)SudanSurinameSwazilandSwedenSwitzerlandSyrian Arab RepublicTajikistanTanzaniaThailandTimor-LesteTogoTongaTrinidad and TobagoTunisiaTurkeyTurks and Caicos IslandsTuvaluUgandaUkraineUnited Arab EmiratesUnited KingdomUpper middle incomeUruguayUzbekistanVanuatuVenezuela, RBVietnamWest Bank and GazaWorldYemen, Rep.ZambiaZimbabwe línea de tiempo (timeline):
En esta escala de tiempo se presenta un gráfico de 1971 y 2015 de South Asia (IDA & IBRD). Los datos de 1970 están ausentes. El número de observaciones reales por fecha: 45.
Fuente (nombre):
Indicadores del desarrollo mundial
Fuente (organización):
UNESCO Institute for Statistics
Categorías:
Education, Gender
Se ha actualizado:
23 abr 2017 año
Los indicadores de los cambios de valor en los últimos años
Mínimo:
3.297
1 ene 2015 año
Máximo:
19.354
1 ene 1971 año
A la fecha de observación
Valor
Cambio absoluto
El cambio con respecto al valor anterior
1 ene 1971 año
19.354
+19.354
0.0%
1 ene 1972 año
19.295
-0.059
-0.31%
1 ene 1973 año
18.393
-0.902
-4.67%
1 ene 1974 año
17.559
-0.834
-4.53%
1 ene 1975 año
16.682
-0.877
-5.0%
1 ene 1976 año
15.845
-0.837
-5.02%
1 ene 1977 año
14.992
-0.853
-5.38%
1 ene 1978 año
13.784
-1.208
-8.05%
1 ene 1979 año
13.014
-0.771
-5.59%
1 ene 1980 año
12.288
-0.725
-5.57%
1 ene 1981 año
11.377
-0.911
-7.42%
1 ene 1982 año
10.466
-0.911
-8.01%
1 ene 1983 año
9.545
-0.921
-8.8%
1 ene 1984 año
8.588
-0.957
-10.03%
1 ene 1985 año
7.506
-1.082
-12.6%
1 ene 1986 año
6.468
-1.038
-13.83%
1 ene 1987 año
5.508
-0.96
-14.84%
1 ene 1988 año
4.545
-0.963
-17.49%
1 ene 1989 año
4.499
-0.045
-1.0%
1 ene 1990 año
4.332
-0.168
-3.73%
1 ene 1991 año
4.399
+0.068
1.56%
1 ene 1992 año
4.44
+0.04
0.91%
1 ene 1993 año
4.372
-0.068
-1.53%
1 ene 1994 año
4.294
-0.078
-1.78%
1 ene 1995 año
4.227
-0.067
-1.56%
1 ene 1996 año
4.161
-0.065
-1.54%
1 ene 1997 año
4.274
+0.113
2.71%
1 ene 1998 año
4.4
+0.126
2.94%
1 ene 1999 año
4.54
+0.14
3.19%
1 ene 2000 año
4.628
+0.088
1.94%
1 ene 2001 año
4.911
+0.283
6.1%
1 ene 2002 año
4.427
-0.484
-9.85%
1 ene 2003 año
4.432
+0.005
0.1%
1 ene 2004 año
4.409
-0.023
-0.52%
1 ene 2005 año
4.58
+0.171
3.88%
1 ene 2006 año
4.708
+0.129
2.81%
1 ene 2007 año
4.655
-0.053
-1.14%
1 ene 2008 año
4.985
+0.33
7.08%
1 ene 2009 año
4.945
-0.04
-0.8%
1 ene 2010 año
5.332
+0.387
7.83%
1 ene 2011 año
5.608
+0.276
5.17%
1 ene 2012 año
5.692
+0.084
1.5%
1 ene 2013 año
4.522
-1.169
-20.54%
1 ene 2014 año
3.363
-1.16
-25.64%
1 ene 2015 año
3.297
-0.066
-1.95%
Ranking de los países por los datos estadísticos actuales


Comentarios: