29
/es/
es
AIzaSyAYiBZKx7MnpbEhh9jyipgxe19OcubqV5w
April 1, 2024
231508
Rwanda
RWA
true
2
1
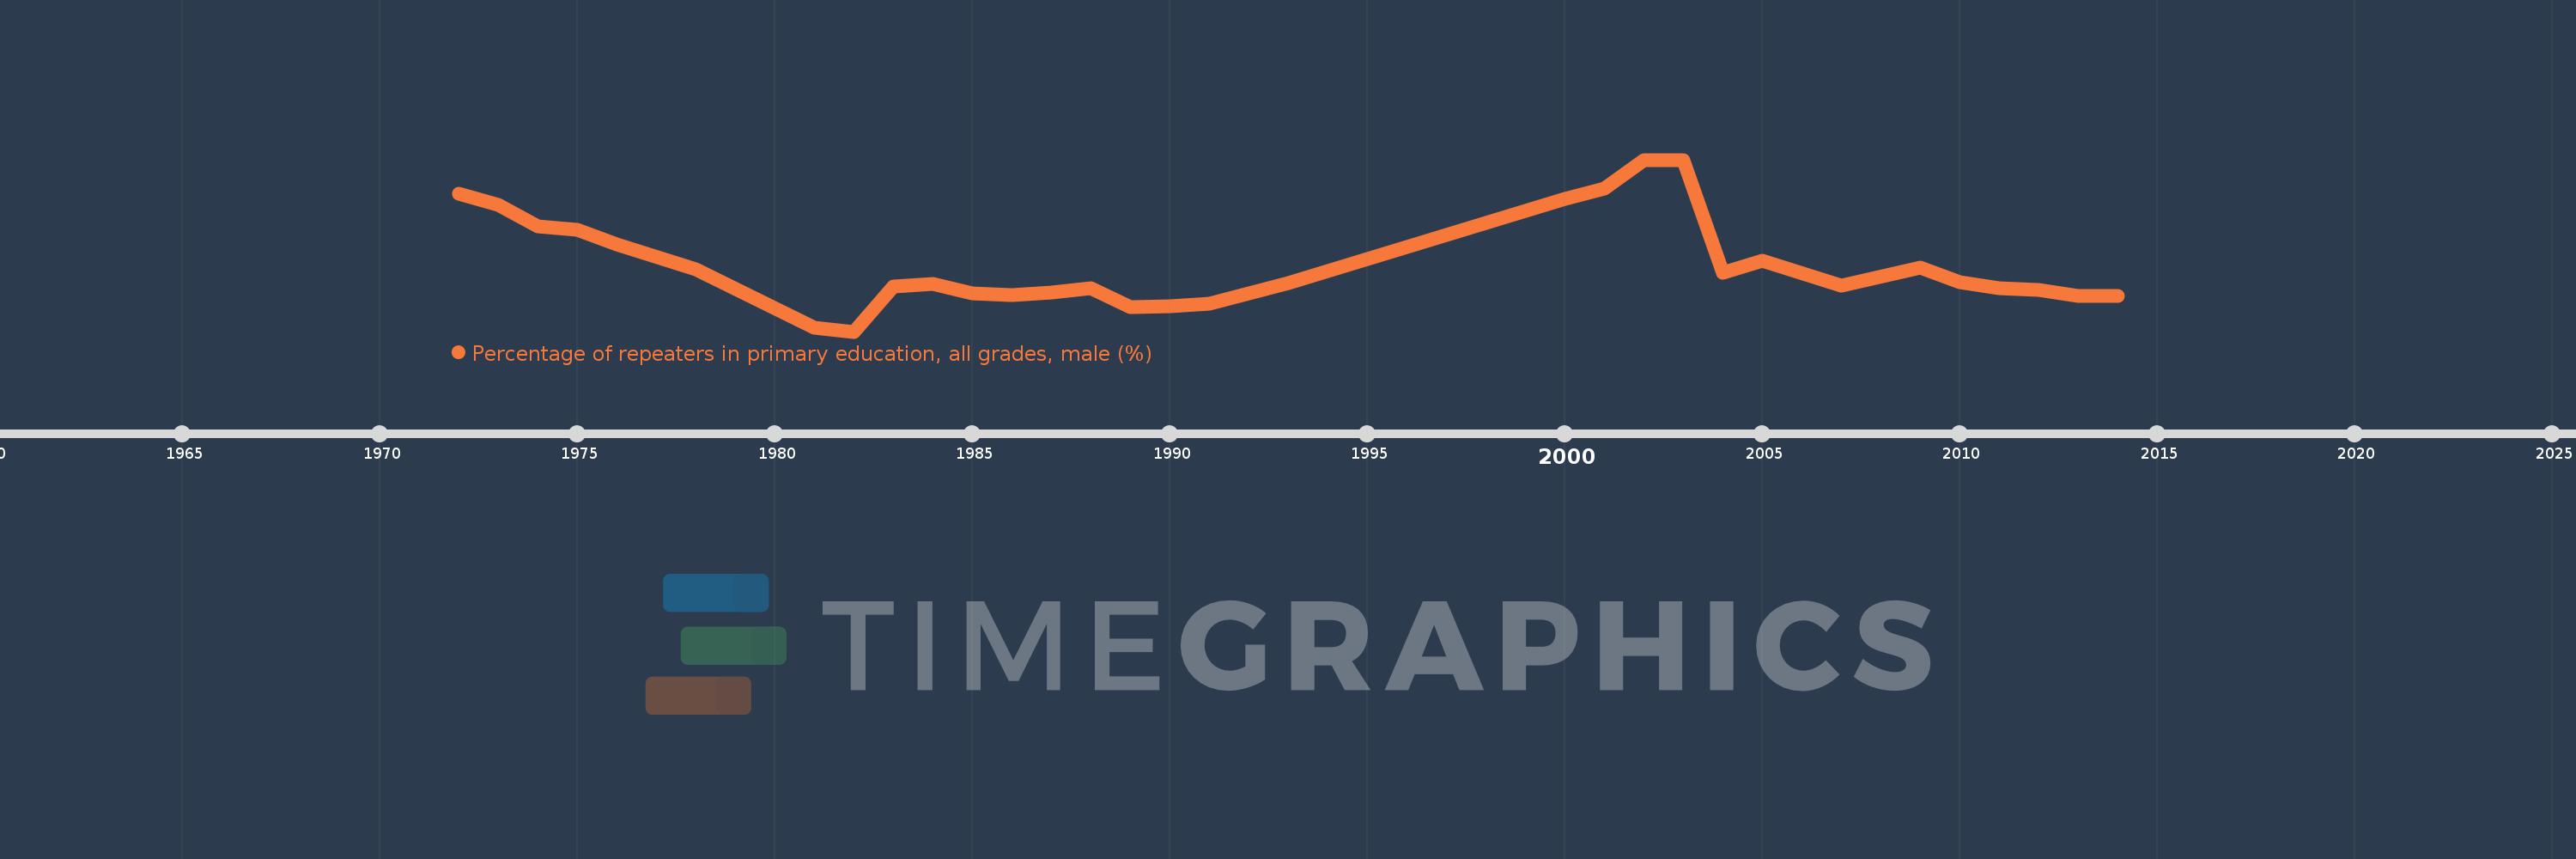
Percentage of repeaters in primary education, all grades, male (%)
2014,2013,2012,2011,2010,2009,2007,2005,2004,2003,2002,2001,2000,1993,1992,1991,1990,1989,1988,1987,1986,1985,1984,1983,1982,1981,1978,1976,1975,1974,1973,1972
Estas estadísticas en otros países:
AfghanistanAlbaniaAlgeriaAndorraAngolaAntigua and BarbudaArab WorldArgentinaArmeniaArubaAustriaAzerbaijanBahamas, TheBahrainBangladeshBelarusBelgiumBelizeBeninBermudaBhutanBoliviaBosnia and HerzegovinaBotswanaBrazilBritish Virgin IslandsBrunei DarussalamBulgariaBurkina FasoBurundiCabo VerdeCambodiaCameroonCanadaCaribbean small statesCayman IslandsCentral African RepublicCentral Europe and the BalticsChadChileChinaColombiaComorosCongo, Dem. Rep.Congo, Rep.Costa RicaCote d'IvoireCroatiaCubaCyprusCzech RepublicDenmarkDjiboutiDominicaDominican RepublicEarly-demographic dividendEast Asia & PacificEast Asia & Pacific (excluding high income)East Asia & Pacific (IDA & IBRD countries)EcuadorEgypt, Arab Rep.El SalvadorEquatorial GuineaEritreaEstoniaEthiopiaEuro areaEurope & Central AsiaEurope & Central Asia (excluding high income)Europe & Central Asia (IDA & IBRD countries)European UnionFijiFinlandFragile and conflict affected situationsFranceGabonGambia, TheGeorgiaGermanyGhanaGreeceGrenadaGuatemalaGuineaGuinea-BissauGuyanaHaitiHeavily indebted poor countries (HIPC)High incomeHondurasHong Kong SAR, ChinaHungaryIBRD onlyIcelandIDA & IBRD totalIDA blendIDA onlyIDA totalIndiaIndonesiaIran, Islamic Rep.IraqIrelandIsraelItalyJamaicaJapanJordanKazakhstanKenyaKiribatiKorea, Rep.KuwaitKyrgyz RepublicLao PDRLate-demographic dividendLatin America & Caribbean Latin America & Caribbean (excluding high income)Latin America & the Caribbean (IDA & IBRD countries)LatviaLeast developed countries: UN classificationLebanonLesothoLiberiaLibyaLiechtensteinLithuaniaLow & middle incomeLow incomeLower middle incomeLuxembourgMacao SAR, ChinaMacedonia, FYRMadagascarMalawiMalaysiaMaldivesMaliMaltaMauritaniaMauritiusMexicoMiddle East & North AfricaMiddle East & North Africa (excluding high income)Middle East & North Africa (IDA & IBRD countries)Middle incomeMoldovaMonacoMongoliaMontenegroMoroccoMozambiqueMyanmarNamibiaNauruNepalNetherlandsNew ZealandNicaraguaNigerNorwayOECD membersOmanOther small statesPacific island small statesPakistanPalauPanamaPapua New GuineaParaguayPeruPhilippinesPolandPortugalPost-demographic dividendPre-demographic dividendQatarRomaniaRussian FederationRwandaSamoaSan MarinoSao Tome and PrincipeSaudi ArabiaSenegalSerbiaSeychellesSierra LeoneSingaporeSint Maarten (Dutch part)Slovak RepublicSloveniaSmall statesSolomon IslandsSomaliaSouth AfricaSouth AsiaSouth Asia (IDA & IBRD)South SudanSpainSri LankaSt. Kitts and NevisSt. LuciaSt. Vincent and the GrenadinesSub-Saharan Africa Sub-Saharan Africa (excluding high income)Sub-Saharan Africa (IDA & IBRD countries)SudanSurinameSwazilandSwedenSwitzerlandSyrian Arab RepublicTajikistanTanzaniaThailandTimor-LesteTogoTongaTrinidad and TobagoTunisiaTurkeyTurks and Caicos IslandsTuvaluUgandaUkraineUnited Arab EmiratesUnited KingdomUpper middle incomeUruguayUzbekistanVanuatuVenezuela, RBVietnamWest Bank and GazaWorldYemen, Rep.ZambiaZimbabwe línea de tiempo (timeline):
En esta escala de tiempo se presenta un gráfico de 1972 y 2014 de Rwanda. Los datos de 1971 están ausentes. El número de observaciones reales por fecha: 32.
Fuente (nombre):
Indicadores del desarrollo mundial
Fuente (organización):
UNESCO Institute for Statistics
Categorías:
Education, Gender
Se ha actualizado:
23 abr 2017 año
Los indicadores de los cambios de valor en los últimos años
Mínimo:
6.696
1 ene 1982 año
Máximo:
35.959
1 ene 2002 año
A la fecha de observación
Valor
Cambio absoluto
El cambio con respecto al valor anterior
1 ene 1972 año
30.115
+30.115
0.0%
1 ene 1973 año
28.208
-1.907
-6.33%
1 ene 1974 año
24.634
-3.574
-12.67%
1 ene 1975 año
24.009
-0.625
-2.54%
1 ene 1976 año
21.499
-2.51
-10.45%
1 ene 1978 año
17.321
-4.178
-19.43%
1 ene 1981 año
7.289
-10.032
-57.92%
1 ene 1982 año
6.696
-0.593
-8.14%
1 ene 1983 año
14.364
+7.668
114.52%
1 ene 1984 año
14.821
+0.457
3.18%
1 ene 1985 año
13.235
-1.586
-10.7%
1 ene 1986 año
12.866
-0.369
-2.78%
1 ene 1987 año
13.372
+0.506
3.93%
1 ene 1988 año
14.124
+0.752
5.62%
1 ene 1989 año
10.92
-3.203
-22.68%
1 ene 1990 año
11.045
+0.125
1.14%
1 ene 1991 año
11.449
+0.404
3.66%
1 ene 1992 año
13.278
+1.829
15.97%
1 ene 1993 año
14.938
+1.66
12.5%
1 ene 2000 año
29.234
+14.295
95.69%
1 ene 2001 año
31.011
+1.777
6.08%
1 ene 2002 año
35.959
+4.948
15.96%
1 ene 2003 año
35.957
-0.001
0.0%
1 ene 2004 año
16.672
-19.286
-53.64%
1 ene 2005 año
18.749
+2.078
12.46%
1 ene 2007 año
14.57
-4.179
-22.29%
1 ene 2009 año
17.597
+3.026
20.77%
1 ene 2010 año
15.111
-2.485
-14.12%
1 ene 2011 año
14.079
-1.033
-6.84%
1 ene 2012 año
13.862
-0.216
-1.53%
1 ene 2013 año
12.738
-1.124
-8.11%
1 ene 2014 año
12.769
+0.031
0.24%
Ranking de los países por los datos estadísticos actuales


Comentarios: