29
/es/
es
AIzaSyAYiBZKx7MnpbEhh9jyipgxe19OcubqV5w
April 1, 2024
218814
Panama
PAN
true
2
1
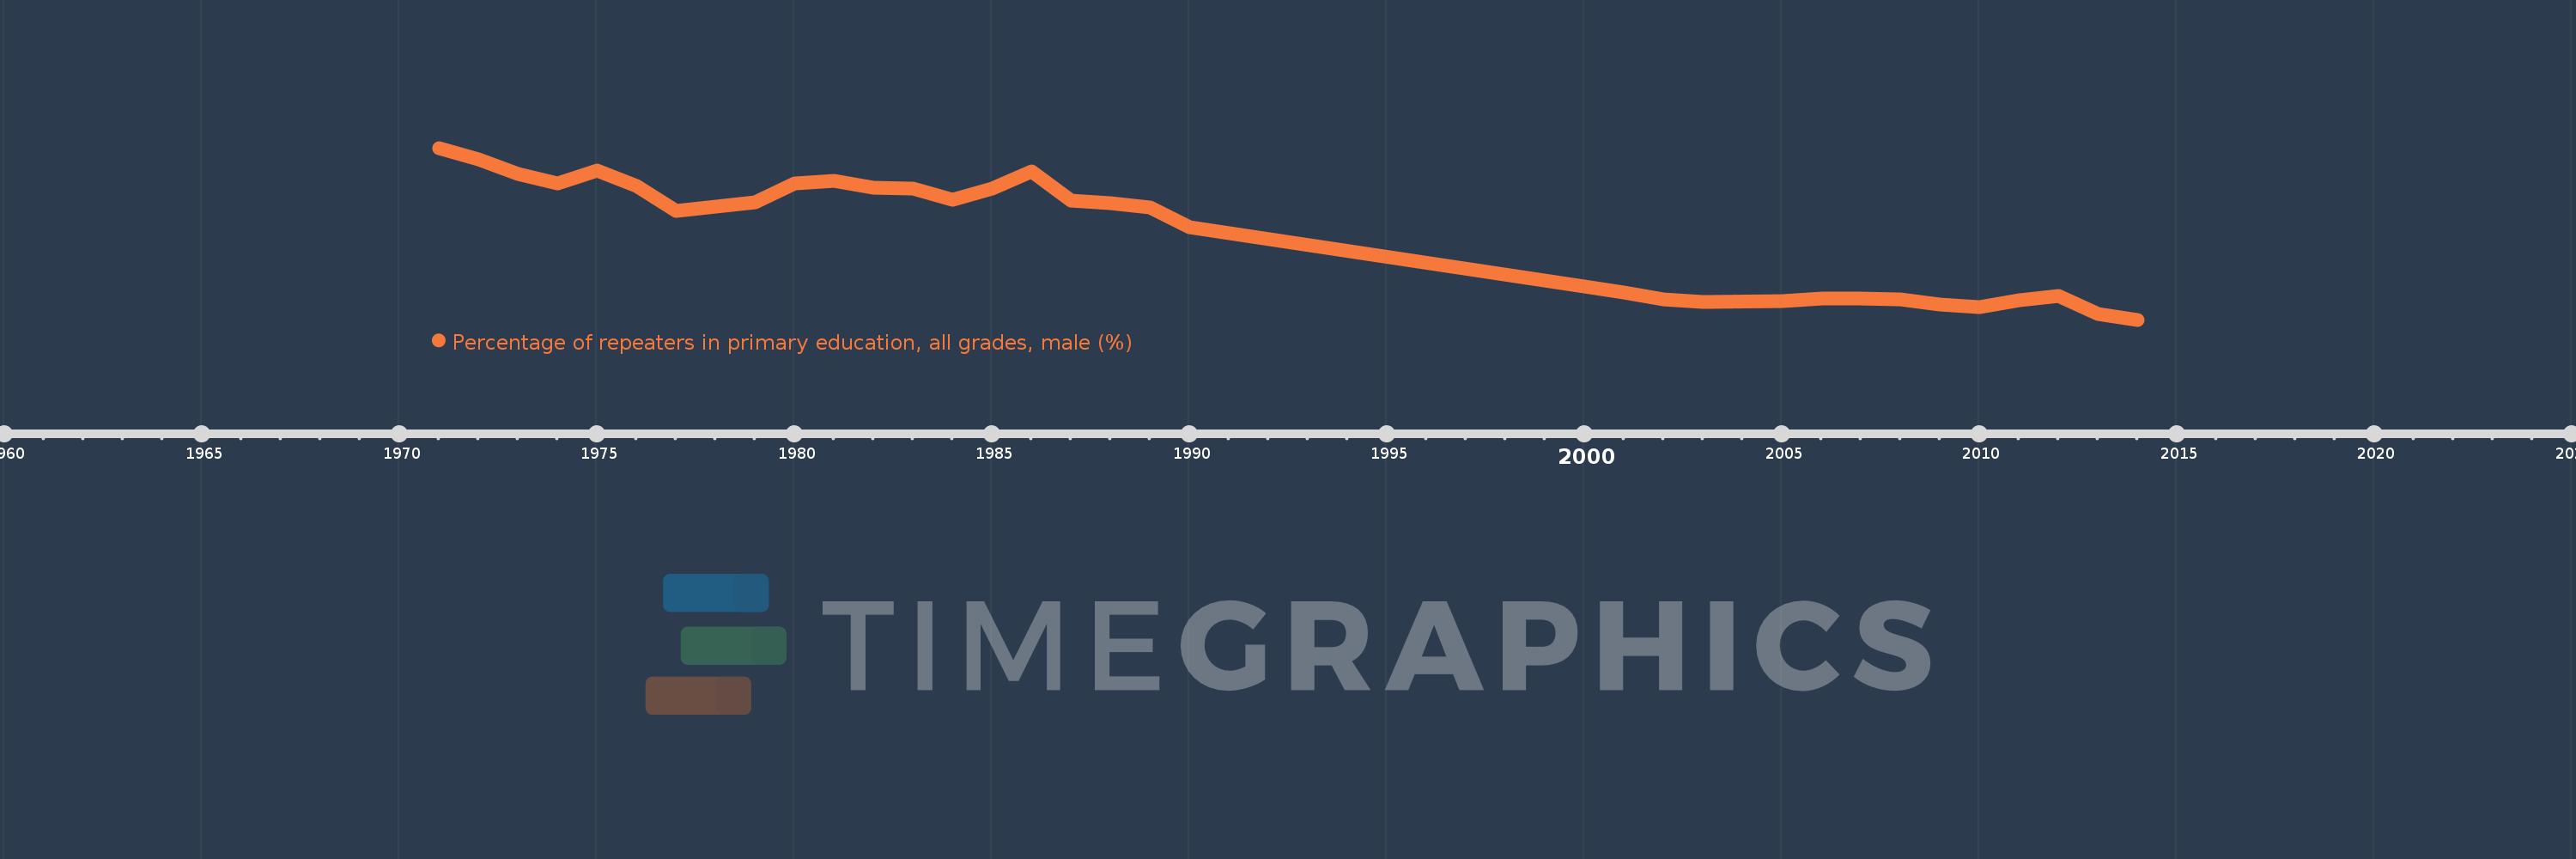
Percentage of repeaters in primary education, all grades, male (%)
2014,2013,2012,2011,2010,2009,2008,2007,2006,2005,2003,2002,2001,2000,1990,1989,1988,1987,1986,1985,1984,1983,1982,1981,1980,1979,1978,1977,1976,1975,1974,1973,1972,1971
Estas estadísticas en otros países:
AfghanistanAlbaniaAlgeriaAndorraAngolaAntigua and BarbudaArab WorldArgentinaArmeniaArubaAustriaAzerbaijanBahamas, TheBahrainBangladeshBelarusBelgiumBelizeBeninBermudaBhutanBoliviaBosnia and HerzegovinaBotswanaBrazilBritish Virgin IslandsBrunei DarussalamBulgariaBurkina FasoBurundiCabo VerdeCambodiaCameroonCanadaCaribbean small statesCayman IslandsCentral African RepublicCentral Europe and the BalticsChadChileChinaColombiaComorosCongo, Dem. Rep.Congo, Rep.Costa RicaCote d'IvoireCroatiaCubaCyprusCzech RepublicDenmarkDjiboutiDominicaDominican RepublicEarly-demographic dividendEast Asia & PacificEast Asia & Pacific (excluding high income)East Asia & Pacific (IDA & IBRD countries)EcuadorEgypt, Arab Rep.El SalvadorEquatorial GuineaEritreaEstoniaEthiopiaEuro areaEurope & Central AsiaEurope & Central Asia (excluding high income)Europe & Central Asia (IDA & IBRD countries)European UnionFijiFinlandFragile and conflict affected situationsFranceGabonGambia, TheGeorgiaGermanyGhanaGreeceGrenadaGuatemalaGuineaGuinea-BissauGuyanaHaitiHeavily indebted poor countries (HIPC)High incomeHondurasHong Kong SAR, ChinaHungaryIBRD onlyIcelandIDA & IBRD totalIDA blendIDA onlyIDA totalIndiaIndonesiaIran, Islamic Rep.IraqIrelandIsraelItalyJamaicaJapanJordanKazakhstanKenyaKiribatiKorea, Rep.KuwaitKyrgyz RepublicLao PDRLate-demographic dividendLatin America & Caribbean Latin America & Caribbean (excluding high income)Latin America & the Caribbean (IDA & IBRD countries)LatviaLeast developed countries: UN classificationLebanonLesothoLiberiaLibyaLiechtensteinLithuaniaLow & middle incomeLow incomeLower middle incomeLuxembourgMacao SAR, ChinaMacedonia, FYRMadagascarMalawiMalaysiaMaldivesMaliMaltaMauritaniaMauritiusMexicoMiddle East & North AfricaMiddle East & North Africa (excluding high income)Middle East & North Africa (IDA & IBRD countries)Middle incomeMoldovaMonacoMongoliaMontenegroMoroccoMozambiqueMyanmarNamibiaNauruNepalNetherlandsNew ZealandNicaraguaNigerNorwayOECD membersOmanOther small statesPacific island small statesPakistanPalauPanamaPapua New GuineaParaguayPeruPhilippinesPolandPortugalPost-demographic dividendPre-demographic dividendQatarRomaniaRussian FederationRwandaSamoaSan MarinoSao Tome and PrincipeSaudi ArabiaSenegalSerbiaSeychellesSierra LeoneSingaporeSint Maarten (Dutch part)Slovak RepublicSloveniaSmall statesSolomon IslandsSomaliaSouth AfricaSouth AsiaSouth Asia (IDA & IBRD)South SudanSpainSri LankaSt. Kitts and NevisSt. LuciaSt. Vincent and the GrenadinesSub-Saharan Africa Sub-Saharan Africa (excluding high income)Sub-Saharan Africa (IDA & IBRD countries)SudanSurinameSwazilandSwedenSwitzerlandSyrian Arab RepublicTajikistanTanzaniaThailandTimor-LesteTogoTongaTrinidad and TobagoTunisiaTurkeyTurks and Caicos IslandsTuvaluUgandaUkraineUnited Arab EmiratesUnited KingdomUpper middle incomeUruguayUzbekistanVanuatuVenezuela, RBVietnamWest Bank and GazaWorldYemen, Rep.ZambiaZimbabwe línea de tiempo (timeline):
En esta escala de tiempo se presenta un gráfico de 1971 y 2014 de Panama. Los datos de 1970 están ausentes. El número de observaciones reales por fecha: 34.
Fuente (nombre):
Indicadores del desarrollo mundial
Fuente (organización):
UNESCO Institute for Statistics
Categorías:
Education, Gender
Se ha actualizado:
23 abr 2017 año
Los indicadores de los cambios de valor en los últimos años
Mínimo:
5.146
1 ene 2014 año
Máximo:
16.938
1 ene 1971 año
A la fecha de observación
Valor
Cambio absoluto
El cambio con respecto al valor anterior
1 ene 1971 año
16.938
+16.938
0.0%
1 ene 1972 año
16.127
-0.811
-4.79%
1 ene 1973 año
15.16
-0.967
-6.0%
1 ene 1974 año
14.522
-0.638
-4.21%
1 ene 1975 año
15.358
+0.837
5.76%
1 ene 1976 año
14.305
-1.053
-6.86%
1 ene 1977 año
12.61
-1.695
-11.85%
1 ene 1978 año
12.904
+0.294
2.33%
1 ene 1979 año
13.224
+0.32
2.48%
1 ene 1980 año
14.52
+1.296
9.8%
1 ene 1981 año
14.698
+0.178
1.23%
1 ene 1982 año
14.221
-0.477
-3.25%
1 ene 1983 año
14.161
-0.06
-0.42%
1 ene 1984 año
13.355
-0.806
-5.69%
1 ene 1985 año
14.171
+0.816
6.11%
1 ene 1986 año
15.311
+1.14
8.04%
1 ene 1987 año
13.306
-2.005
-13.09%
1 ene 1988 año
13.14
-0.166
-1.25%
1 ene 1989 año
12.88
-0.26
-1.98%
1 ene 1990 año
11.522
-1.359
-10.55%
1 ene 2000 año
7.433
-4.089
-35.49%
1 ene 2001 año
7.042
-0.391
-5.26%
1 ene 2002 año
6.554
-0.488
-6.93%
1 ene 2003 año
6.37
-0.185
-2.82%
1 ene 2005 año
6.412
+0.043
0.67%
1 ene 2006 año
6.614
+0.202
3.15%
1 ene 2007 año
6.604
-0.01
-0.15%
1 ene 2008 año
6.519
-0.085
-1.29%
1 ene 2009 año
6.211
-0.308
-4.72%
1 ene 2010 año
6.012
-0.199
-3.21%
1 ene 2011 año
6.511
+0.499
8.3%
1 ene 2012 año
6.791
+0.28
4.29%
1 ene 2013 año
5.521
-1.269
-18.69%
1 ene 2014 año
5.146
-0.375
-6.8%
Ranking de los países por los datos estadísticos actuales


Comentarios: