29
/es/
es
AIzaSyAYiBZKx7MnpbEhh9jyipgxe19OcubqV5w
April 1, 2024
45455
Low & middle income
LMY
false
2
1
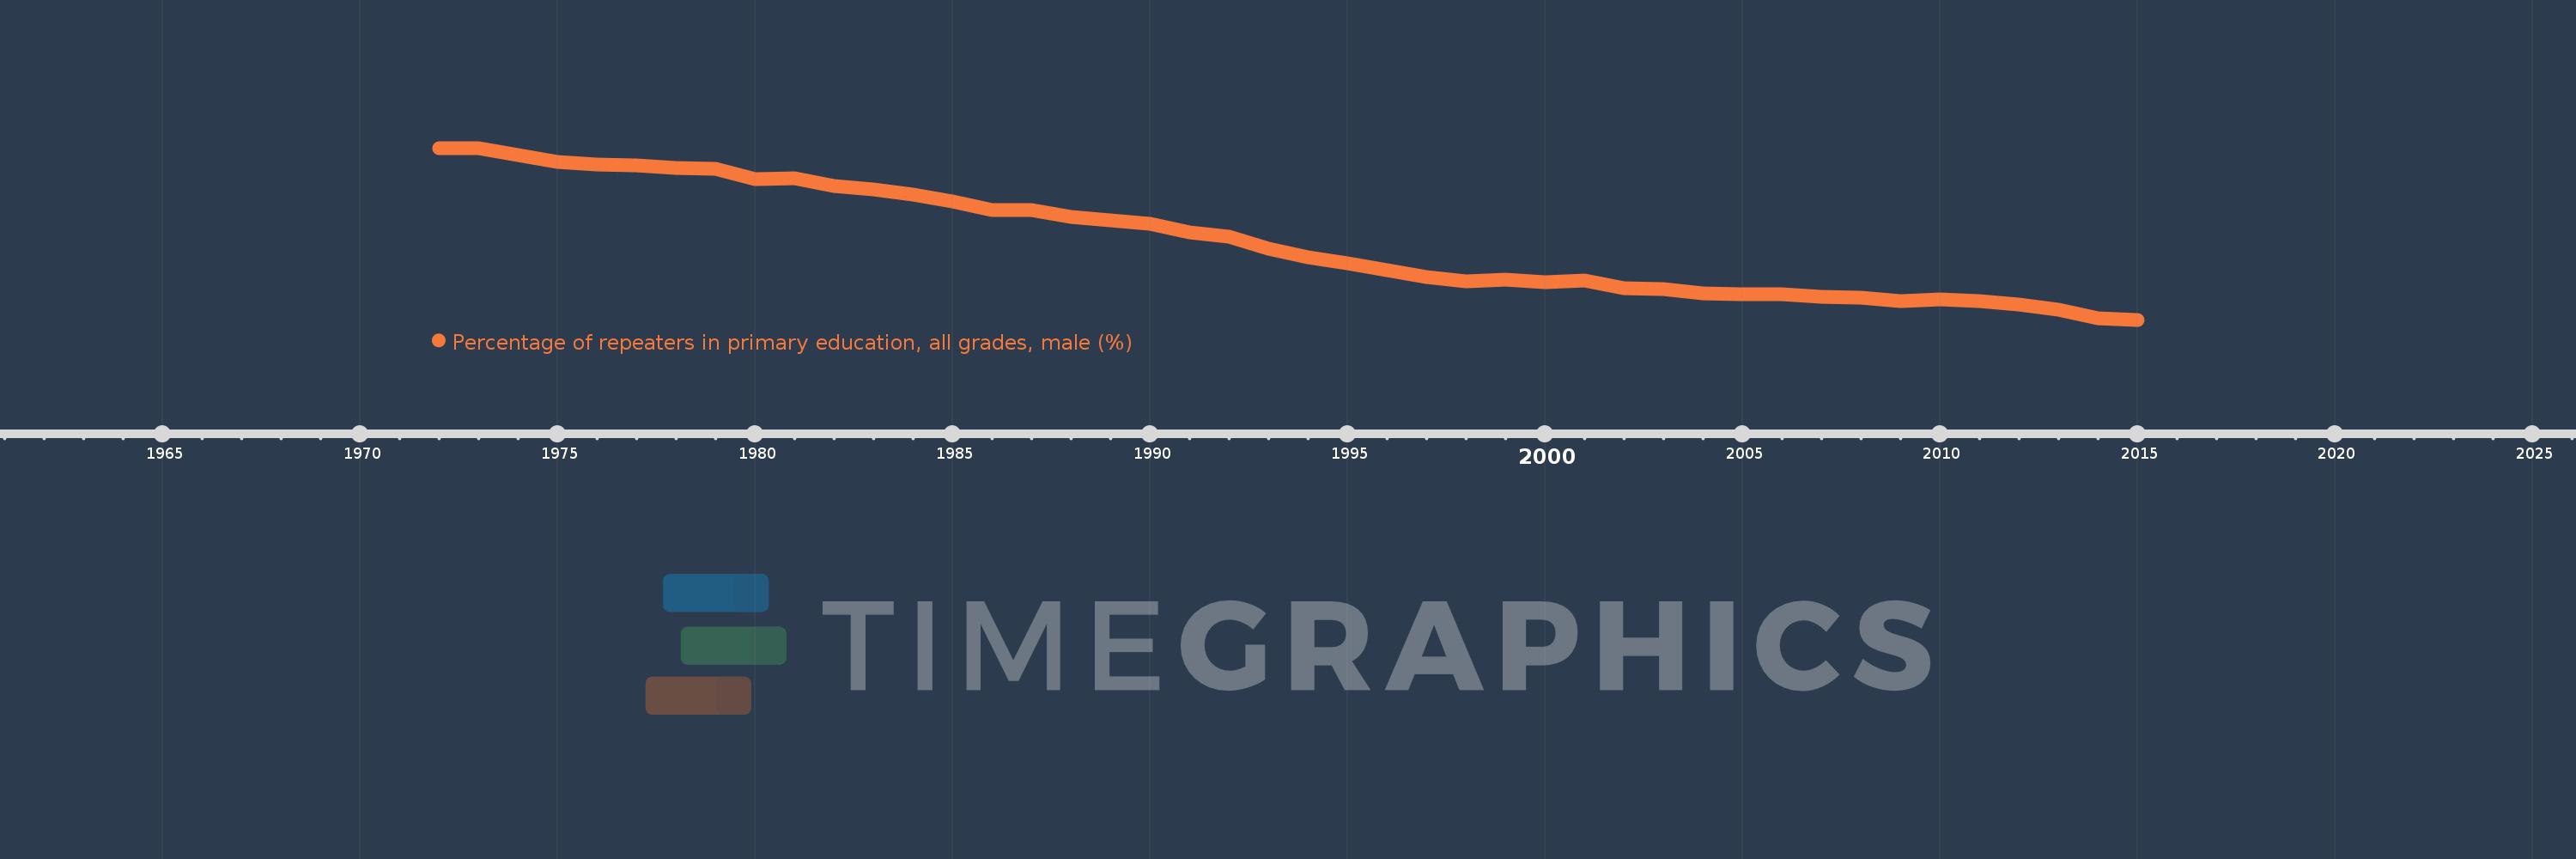
Percentage of repeaters in primary education, all grades, male (%)
2015,2014,2013,2012,2011,2010,2009,2008,2007,2006,2005,2004,2003,2002,2001,2000,1999,1998,1997,1996,1995,1994,1993,1992,1991,1990,1989,1988,1987,1986,1985,1984,1983,1982,1981,1980,1979,1978,1977,1976,1975,1974,1973,1972
Estas estadísticas en otros países:
AfghanistanAlbaniaAlgeriaAndorraAngolaAntigua and BarbudaArab WorldArgentinaArmeniaArubaAustriaAzerbaijanBahamas, TheBahrainBangladeshBelarusBelgiumBelizeBeninBermudaBhutanBoliviaBosnia and HerzegovinaBotswanaBrazilBritish Virgin IslandsBrunei DarussalamBulgariaBurkina FasoBurundiCabo VerdeCambodiaCameroonCanadaCaribbean small statesCayman IslandsCentral African RepublicCentral Europe and the BalticsChadChileChinaColombiaComorosCongo, Dem. Rep.Congo, Rep.Costa RicaCote d'IvoireCroatiaCubaCyprusCzech RepublicDenmarkDjiboutiDominicaDominican RepublicEarly-demographic dividendEast Asia & PacificEast Asia & Pacific (excluding high income)East Asia & Pacific (IDA & IBRD countries)EcuadorEgypt, Arab Rep.El SalvadorEquatorial GuineaEritreaEstoniaEthiopiaEuro areaEurope & Central AsiaEurope & Central Asia (excluding high income)Europe & Central Asia (IDA & IBRD countries)European UnionFijiFinlandFragile and conflict affected situationsFranceGabonGambia, TheGeorgiaGermanyGhanaGreeceGrenadaGuatemalaGuineaGuinea-BissauGuyanaHaitiHeavily indebted poor countries (HIPC)High incomeHondurasHong Kong SAR, ChinaHungaryIBRD onlyIcelandIDA & IBRD totalIDA blendIDA onlyIDA totalIndiaIndonesiaIran, Islamic Rep.IraqIrelandIsraelItalyJamaicaJapanJordanKazakhstanKenyaKiribatiKorea, Rep.KuwaitKyrgyz RepublicLao PDRLate-demographic dividendLatin America & Caribbean Latin America & Caribbean (excluding high income)Latin America & the Caribbean (IDA & IBRD countries)LatviaLeast developed countries: UN classificationLebanonLesothoLiberiaLibyaLiechtensteinLithuaniaLow & middle incomeLow incomeLower middle incomeLuxembourgMacao SAR, ChinaMacedonia, FYRMadagascarMalawiMalaysiaMaldivesMaliMaltaMauritaniaMauritiusMexicoMiddle East & North AfricaMiddle East & North Africa (excluding high income)Middle East & North Africa (IDA & IBRD countries)Middle incomeMoldovaMonacoMongoliaMontenegroMoroccoMozambiqueMyanmarNamibiaNauruNepalNetherlandsNew ZealandNicaraguaNigerNorwayOECD membersOmanOther small statesPacific island small statesPakistanPalauPanamaPapua New GuineaParaguayPeruPhilippinesPolandPortugalPost-demographic dividendPre-demographic dividendQatarRomaniaRussian FederationRwandaSamoaSan MarinoSao Tome and PrincipeSaudi ArabiaSenegalSerbiaSeychellesSierra LeoneSingaporeSint Maarten (Dutch part)Slovak RepublicSloveniaSmall statesSolomon IslandsSomaliaSouth AfricaSouth AsiaSouth Asia (IDA & IBRD)South SudanSpainSri LankaSt. Kitts and NevisSt. LuciaSt. Vincent and the GrenadinesSub-Saharan Africa Sub-Saharan Africa (excluding high income)Sub-Saharan Africa (IDA & IBRD countries)SudanSurinameSwazilandSwedenSwitzerlandSyrian Arab RepublicTajikistanTanzaniaThailandTimor-LesteTogoTongaTrinidad and TobagoTunisiaTurkeyTurks and Caicos IslandsTuvaluUgandaUkraineUnited Arab EmiratesUnited KingdomUpper middle incomeUruguayUzbekistanVanuatuVenezuela, RBVietnamWest Bank and GazaWorldYemen, Rep.ZambiaZimbabwe línea de tiempo (timeline):
En esta escala de tiempo se presenta un gráfico de 1972 y 2015 de Low & middle income. Los datos de 1971 están ausentes. El número de observaciones reales por fecha: 44.
Fuente (nombre):
Indicadores del desarrollo mundial
Fuente (organización):
UNESCO Institute for Statistics
Categorías:
Education, Gender
Se ha actualizado:
23 abr 2017 año
Los indicadores de los cambios de valor en los últimos años
Mínimo:
3.916
1 ene 2015 año
Máximo:
13.237
1 ene 1972 año
A la fecha de observación
Valor
Cambio absoluto
El cambio con respecto al valor anterior
1 ene 1972 año
13.237
+13.237
0.0%
1 ene 1973 año
13.219
-0.018
-0.14%
1 ene 1974 año
12.84
-0.379
-2.87%
1 ene 1975 año
12.484
-0.356
-2.77%
1 ene 1976 año
12.341
-0.143
-1.14%
1 ene 1977 año
12.29
-0.051
-0.41%
1 ene 1978 año
12.166
-0.124
-1.01%
1 ene 1979 año
12.088
-0.079
-0.65%
1 ene 1980 año
11.537
-0.55
-4.55%
1 ene 1981 año
11.609
+0.072
0.62%
1 ene 1982 año
11.18
-0.429
-3.7%
1 ene 1983 año
10.978
-0.202
-1.8%
1 ene 1984 año
10.721
-0.257
-2.34%
1 ene 1985 año
10.333
-0.388
-3.62%
1 ene 1986 año
9.885
-0.448
-4.34%
1 ene 1987 año
9.873
-0.012
-0.12%
1 ene 1988 año
9.5
-0.373
-3.78%
1 ene 1989 año
9.327
-0.173
-1.83%
1 ene 1990 año
9.136
-0.191
-2.04%
1 ene 1991 año
8.672
-0.464
-5.08%
1 ene 1992 año
8.4
-0.272
-3.13%
1 ene 1993 año
7.783
-0.617
-7.35%
1 ene 1994 año
7.312
-0.472
-6.06%
1 ene 1995 año
6.979
-0.333
-4.55%
1 ene 1996 año
6.611
-0.367
-5.26%
1 ene 1997 año
6.243
-0.368
-5.57%
1 ene 1998 año
6.007
-0.236
-3.79%
1 ene 1999 año
6.07
+0.063
1.05%
1 ene 2000 año
5.972
-0.098
-1.61%
1 ene 2001 año
6.039
+0.067
1.12%
1 ene 2002 año
5.61
-0.429
-7.1%
1 ene 2003 año
5.56
-0.05
-0.9%
1 ene 2004 año
5.364
-0.196
-3.53%
1 ene 2005 año
5.309
-0.055
-1.02%
1 ene 2006 año
5.323
+0.014
0.26%
1 ene 2007 año
5.169
-0.154
-2.89%
1 ene 2008 año
5.132
-0.037
-0.72%
1 ene 2009 año
4.908
-0.224
-4.37%
1 ene 2010 año
5.002
+0.094
1.92%
1 ene 2011 año
4.907
-0.095
-1.9%
1 ene 2012 año
4.761
-0.147
-2.99%
1 ene 2013 año
4.463
-0.298
-6.25%
1 ene 2014 año
4.001
-0.462
-10.35%
1 ene 2015 año
3.916
-0.085
-2.12%
Ranking de los países por los datos estadísticos actuales


Comentarios: