29
/es/
es
AIzaSyAYiBZKx7MnpbEhh9jyipgxe19OcubqV5w
April 1, 2024
50350
Middle East & North Africa (IDA & IBRD countries)
TMN
false
2
1
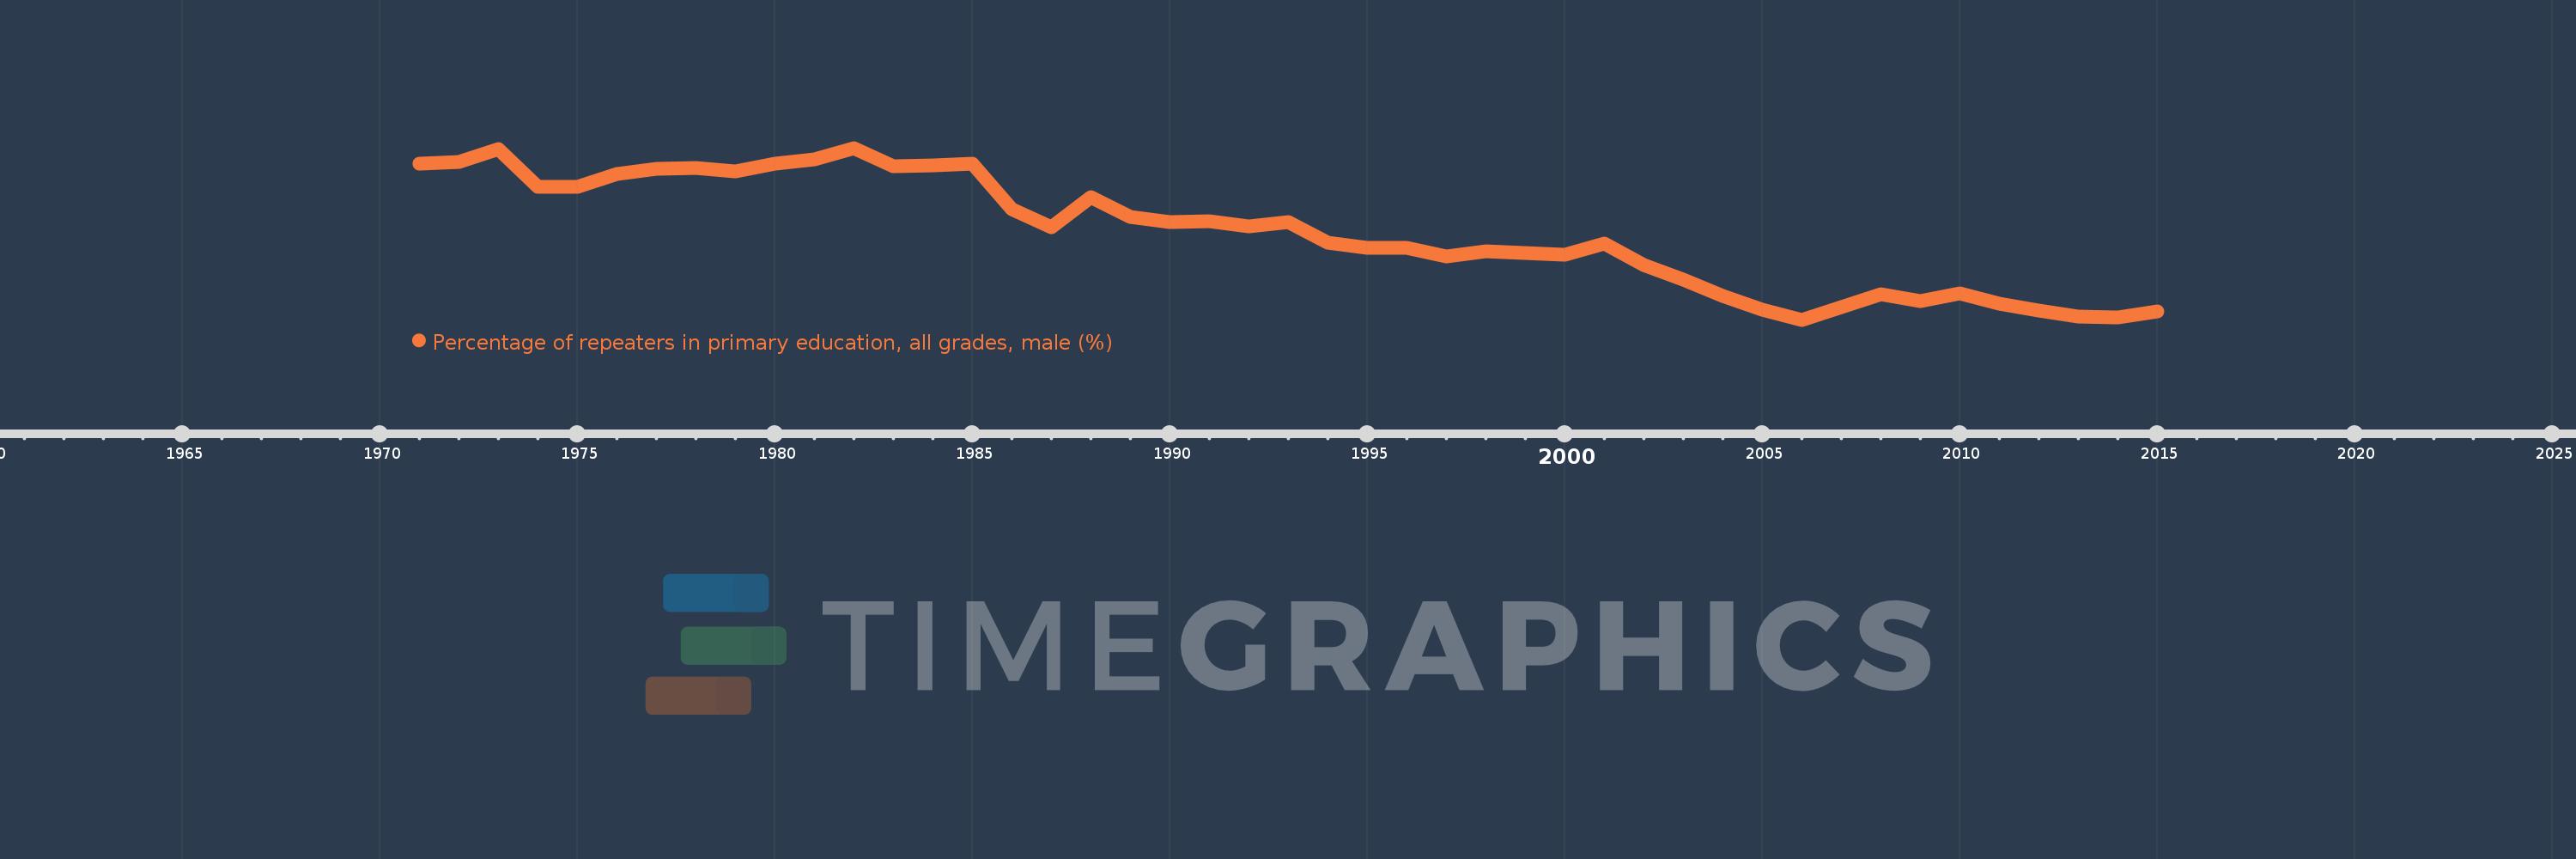
Percentage of repeaters in primary education, all grades, male (%)
2015,2014,2013,2012,2011,2010,2009,2008,2007,2006,2005,2004,2003,2002,2001,2000,1999,1998,1997,1996,1995,1994,1993,1992,1991,1990,1989,1988,1987,1986,1985,1984,1983,1982,1981,1980,1979,1978,1977,1976,1975,1974,1973,1972,1971
Estas estadísticas en otros países:
AfghanistanAlbaniaAlgeriaAndorraAngolaAntigua and BarbudaArab WorldArgentinaArmeniaArubaAustriaAzerbaijanBahamas, TheBahrainBangladeshBelarusBelgiumBelizeBeninBermudaBhutanBoliviaBosnia and HerzegovinaBotswanaBrazilBritish Virgin IslandsBrunei DarussalamBulgariaBurkina FasoBurundiCabo VerdeCambodiaCameroonCanadaCaribbean small statesCayman IslandsCentral African RepublicCentral Europe and the BalticsChadChileChinaColombiaComorosCongo, Dem. Rep.Congo, Rep.Costa RicaCote d'IvoireCroatiaCubaCyprusCzech RepublicDenmarkDjiboutiDominicaDominican RepublicEarly-demographic dividendEast Asia & PacificEast Asia & Pacific (excluding high income)East Asia & Pacific (IDA & IBRD countries)EcuadorEgypt, Arab Rep.El SalvadorEquatorial GuineaEritreaEstoniaEthiopiaEuro areaEurope & Central AsiaEurope & Central Asia (excluding high income)Europe & Central Asia (IDA & IBRD countries)European UnionFijiFinlandFragile and conflict affected situationsFranceGabonGambia, TheGeorgiaGermanyGhanaGreeceGrenadaGuatemalaGuineaGuinea-BissauGuyanaHaitiHeavily indebted poor countries (HIPC)High incomeHondurasHong Kong SAR, ChinaHungaryIBRD onlyIcelandIDA & IBRD totalIDA blendIDA onlyIDA totalIndiaIndonesiaIran, Islamic Rep.IraqIrelandIsraelItalyJamaicaJapanJordanKazakhstanKenyaKiribatiKorea, Rep.KuwaitKyrgyz RepublicLao PDRLate-demographic dividendLatin America & Caribbean Latin America & Caribbean (excluding high income)Latin America & the Caribbean (IDA & IBRD countries)LatviaLeast developed countries: UN classificationLebanonLesothoLiberiaLibyaLiechtensteinLithuaniaLow & middle incomeLow incomeLower middle incomeLuxembourgMacao SAR, ChinaMacedonia, FYRMadagascarMalawiMalaysiaMaldivesMaliMaltaMauritaniaMauritiusMexicoMiddle East & North AfricaMiddle East & North Africa (excluding high income)Middle East & North Africa (IDA & IBRD countries)Middle incomeMoldovaMonacoMongoliaMontenegroMoroccoMozambiqueMyanmarNamibiaNauruNepalNetherlandsNew ZealandNicaraguaNigerNorwayOECD membersOmanOther small statesPacific island small statesPakistanPalauPanamaPapua New GuineaParaguayPeruPhilippinesPolandPortugalPost-demographic dividendPre-demographic dividendQatarRomaniaRussian FederationRwandaSamoaSan MarinoSao Tome and PrincipeSaudi ArabiaSenegalSerbiaSeychellesSierra LeoneSingaporeSint Maarten (Dutch part)Slovak RepublicSloveniaSmall statesSolomon IslandsSomaliaSouth AfricaSouth AsiaSouth Asia (IDA & IBRD)South SudanSpainSri LankaSt. Kitts and NevisSt. LuciaSt. Vincent and the GrenadinesSub-Saharan Africa Sub-Saharan Africa (excluding high income)Sub-Saharan Africa (IDA & IBRD countries)SudanSurinameSwazilandSwedenSwitzerlandSyrian Arab RepublicTajikistanTanzaniaThailandTimor-LesteTogoTongaTrinidad and TobagoTunisiaTurkeyTurks and Caicos IslandsTuvaluUgandaUkraineUnited Arab EmiratesUnited KingdomUpper middle incomeUruguayUzbekistanVanuatuVenezuela, RBVietnamWest Bank and GazaWorldYemen, Rep.ZambiaZimbabwe línea de tiempo (timeline):
En esta escala de tiempo se presenta un gráfico de 1971 y 2015 de Middle East & North Africa (IDA & IBRD countries). Los datos de 1970 están ausentes. El número de observaciones reales por fecha: 45.
Fuente (nombre):
Indicadores del desarrollo mundial
Fuente (organización):
UNESCO Institute for Statistics
Categorías:
Education, Gender
Se ha actualizado:
23 abr 2017 año
Los indicadores de los cambios de valor en los últimos años
Mínimo:
7.55
1 ene 2006 año
Máximo:
13.676
1 ene 1982 año
A la fecha de observación
Valor
Cambio absoluto
El cambio con respecto al valor anterior
1 ene 1971 año
13.101
+13.101
0.0%
1 ene 1972 año
13.17
+0.069
0.52%
1 ene 1973 año
13.641
+0.471
3.58%
1 ene 1974 año
12.288
-1.353
-9.92%
1 ene 1975 año
12.285
-0.003
-0.03%
1 ene 1976 año
12.742
+0.457
3.72%
1 ene 1977 año
12.944
+0.202
1.59%
1 ene 1978 año
12.959
+0.015
0.12%
1 ene 1979 año
12.832
-0.126
-0.98%
1 ene 1980 año
13.126
+0.294
2.29%
1 ene 1981 año
13.277
+0.151
1.15%
1 ene 1982 año
13.676
+0.399
3.01%
1 ene 1983 año
13.032
-0.645
-4.71%
1 ene 1984 año
13.064
+0.032
0.25%
1 ene 1985 año
13.107
+0.043
0.33%
1 ene 1986 año
11.486
-1.621
-12.36%
1 ene 1987 año
10.858
-0.629
-5.47%
1 ene 1988 año
11.91
+1.052
9.69%
1 ene 1989 año
11.215
-0.694
-5.83%
1 ene 1990 año
11.022
-0.193
-1.72%
1 ene 1991 año
11.078
+0.056
0.51%
1 ene 1992 año
10.87
-0.208
-1.88%
1 ene 1993 año
11.042
+0.172
1.58%
1 ene 1994 año
10.287
-0.754
-6.83%
1 ene 1995 año
10.108
-0.179
-1.74%
1 ene 1996 año
10.122
+0.014
0.14%
1 ene 1997 año
9.801
-0.322
-3.18%
1 ene 1998 año
9.981
+0.181
1.84%
1 ene 1999 año
9.942
-0.039
-0.39%
1 ene 2000 año
9.883
-0.058
-0.59%
1 ene 2001 año
10.267
+0.384
3.88%
1 ene 2002 año
9.507
-0.76
-7.41%
1 ene 2003 año
8.972
-0.535
-5.63%
1 ene 2004 año
8.411
-0.56
-6.25%
1 ene 2005 año
7.904
-0.507
-6.03%
1 ene 2006 año
7.55
-0.354
-4.47%
1 ene 2007 año
8.012
+0.462
6.11%
1 ene 2008 año
8.475
+0.463
5.77%
1 ene 2009 año
8.222
-0.252
-2.98%
1 ene 2010 año
8.476
+0.253
3.08%
1 ene 2011 año
8.111
-0.365
-4.31%
1 ene 2012 año
7.881
-0.229
-2.83%
1 ene 2013 año
7.649
-0.233
-2.95%
1 ene 2014 año
7.647
-0.002
-0.03%
1 ene 2015 año
7.861
+0.215
2.81%
Ranking de los países por los datos estadísticos actuales


Comentarios: