29
/es/
es
AIzaSyAYiBZKx7MnpbEhh9jyipgxe19OcubqV5w
April 1, 2024
57663
South Asia
SAS
false
2
1
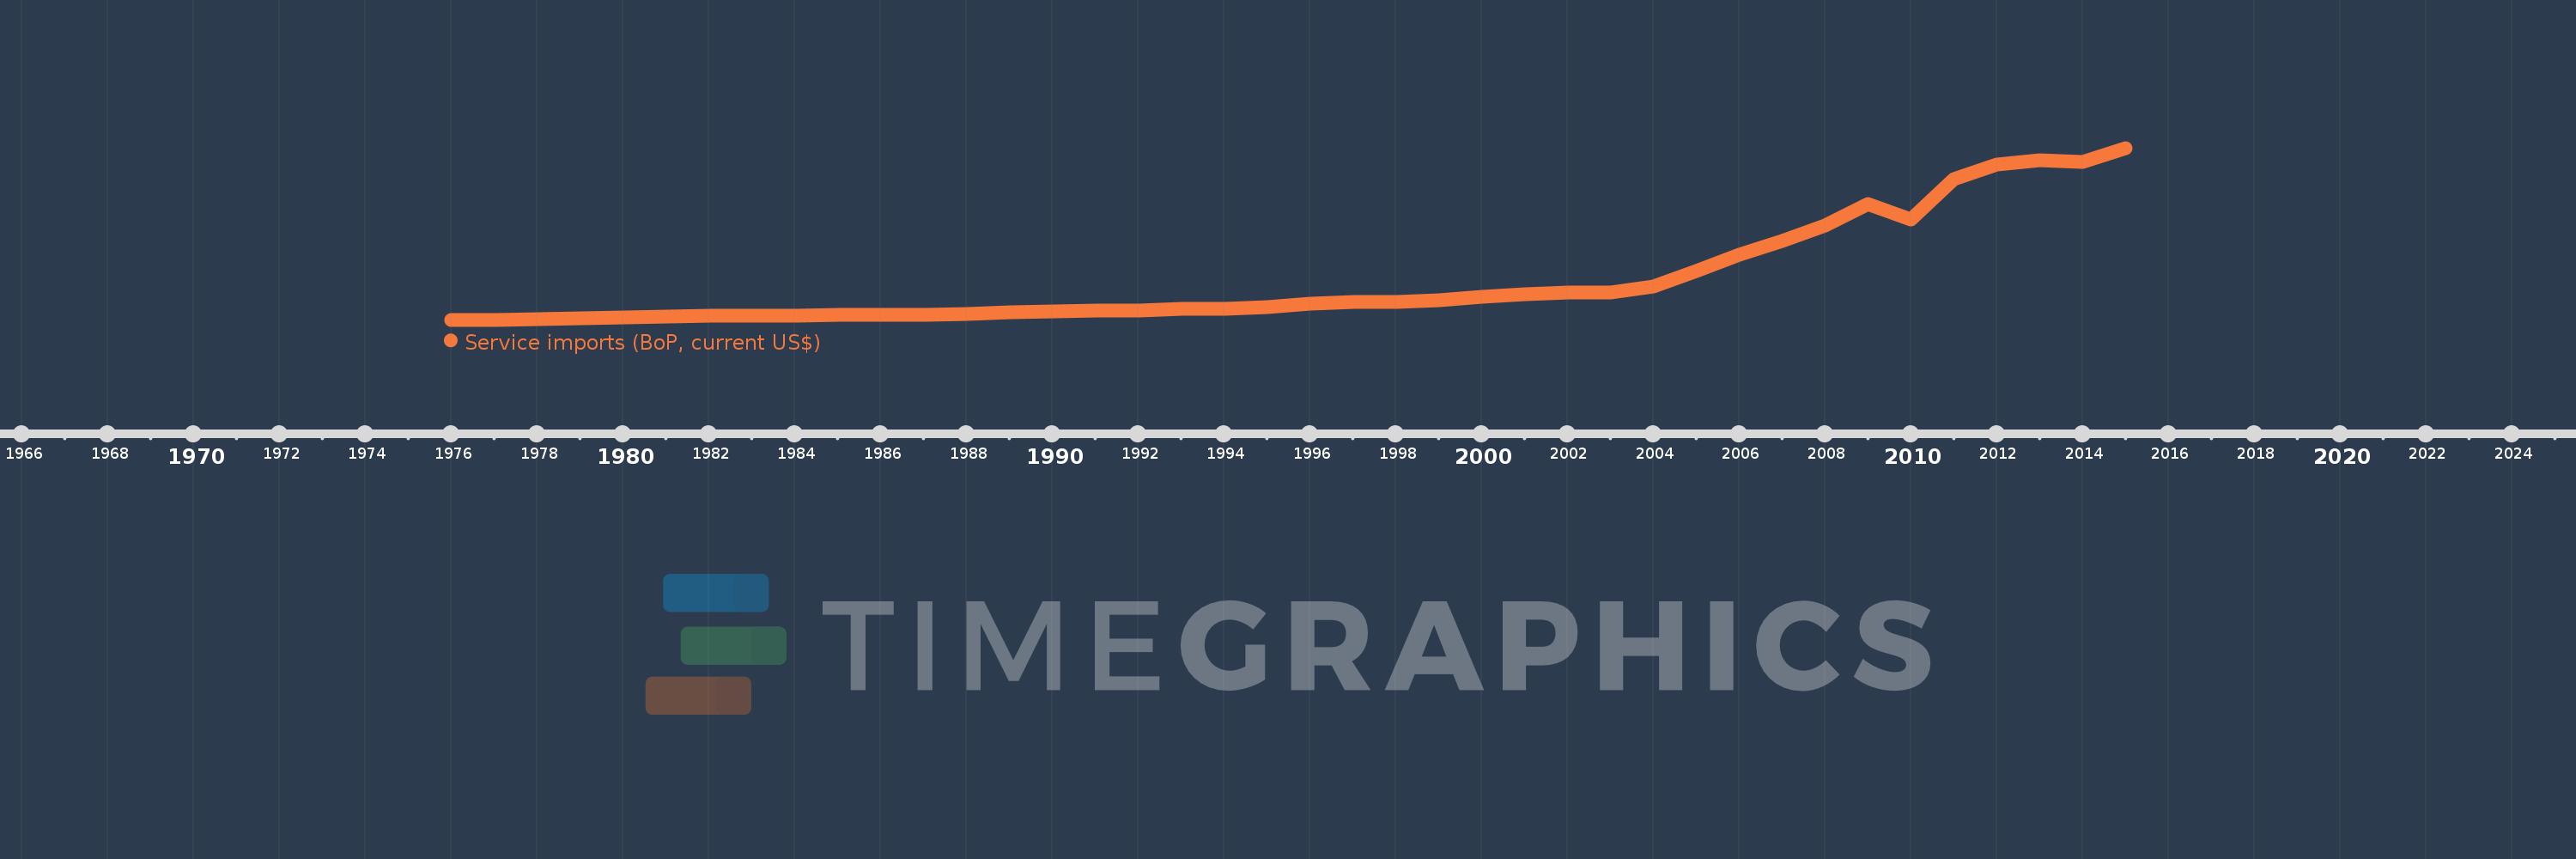
Service imports (BoP, current US$)
2015,2014,2013,2012,2011,2010,2009,2008,2007,2006,2005,2004,2003,2002,2001,2000,1999,1998,1997,1996,1995,1994,1993,1992,1991,1990,1989,1988,1987,1986,1985,1984,1983,1982,1981,1980,1979,1978,1977,1976
Estas estadísticas en otros países:
AfghanistanAlbaniaAlgeriaAngolaAntigua and BarbudaArab WorldArgentinaArmeniaArubaAustraliaAustriaAzerbaijanBahamas, TheBahrainBangladeshBarbadosBelarusBelgiumBelizeBeninBermudaBhutanBoliviaBosnia and HerzegovinaBotswanaBrazilBrunei DarussalamBulgariaBurkina FasoBurundiCabo VerdeCambodiaCameroonCanadaCaribbean small statesCentral African RepublicCentral Europe and the BalticsChadChileChinaColombiaComorosCongo, Dem. Rep.Congo, Rep.Costa RicaCote d'IvoireCroatiaCuracaoCyprusCzech RepublicDenmarkDjiboutiDominicaDominican RepublicEarly-demographic dividendEast Asia & PacificEast Asia & Pacific (excluding high income)East Asia & Pacific (IDA & IBRD countries)EcuadorEgypt, Arab Rep.El SalvadorEquatorial GuineaEritreaEstoniaEthiopiaEuro areaEurope & Central AsiaEurope & Central Asia (excluding high income)Europe & Central Asia (IDA & IBRD countries)European UnionFaroe IslandsFijiFinlandFragile and conflict affected situationsFranceFrench PolynesiaGabonGambia, TheGeorgiaGermanyGhanaGreeceGrenadaGuatemalaGuineaGuinea-BissauGuyanaHaitiHeavily indebted poor countries (HIPC)High incomeHondurasHong Kong SAR, ChinaHungaryIBRD onlyIcelandIDA & IBRD totalIDA blendIDA onlyIDA totalIndiaIndonesiaIran, Islamic Rep.IraqIrelandIsraelItalyJamaicaJapanJordanKazakhstanKenyaKiribatiKorea, Rep.KosovoKuwaitKyrgyz RepublicLao PDRLate-demographic dividendLatin America & Caribbean Latin America & Caribbean (excluding high income)Latin America & the Caribbean (IDA & IBRD countries)LatviaLeast developed countries: UN classificationLebanonLesothoLiberiaLibyaLithuaniaLow & middle incomeLow incomeLower middle incomeLuxembourgMacao SAR, ChinaMacedonia, FYRMadagascarMalawiMalaysiaMaldivesMaliMaltaMarshall IslandsMauritaniaMauritiusMexicoMicronesia, Fed. Sts.Middle East & North Africa (excluding high income)Middle East & North Africa (IDA & IBRD countries)Middle incomeMoldovaMongoliaMontenegroMoroccoMozambiqueMyanmarNamibiaNepalNetherlandsNew CaledoniaNew ZealandNicaraguaNigerNigeriaNorth AmericaNorwayOECD membersOmanOther small statesPacific island small statesPakistanPalauPanamaPapua New GuineaParaguayPeruPhilippinesPolandPortugalPost-demographic dividendPre-demographic dividendQatarRomaniaRussian FederationRwandaSamoaSao Tome and PrincipeSaudi ArabiaSenegalSerbiaSeychellesSierra LeoneSingaporeSint Maarten (Dutch part)Slovak RepublicSloveniaSmall statesSolomon IslandsSouth AfricaSouth AsiaSouth Asia (IDA & IBRD)South SudanSpainSri LankaSt. Kitts and NevisSt. LuciaSt. Vincent and the GrenadinesSub-Saharan Africa Sub-Saharan Africa (excluding high income)Sub-Saharan Africa (IDA & IBRD countries)SudanSurinameSwazilandSwedenSwitzerlandSyrian Arab RepublicTajikistanTanzaniaThailandTimor-LesteTogoTongaTrinidad and TobagoTunisiaTurkeyTuvaluUgandaUkraineUnited KingdomUnited StatesUpper middle incomeUruguayVanuatuVenezuela, RBVietnamWest Bank and GazaWorldYemen, Rep.ZambiaZimbabwe línea de tiempo (timeline):
En esta escala de tiempo se presenta un gráfico de 1976 y 2015 de South Asia. Los datos de 1975 están ausentes. El número de observaciones reales por fecha: 40.
Fuente (nombre):
Indicadores del desarrollo mundial
Fuente (organización):
International Monetary Fund, Balance of Payments Statistics Yearbook and data files.
Categorías:
Economy & Growth, Trade
Se ha actualizado:
23 abr 2017 año
Los indicadores de los cambios de valor en los últimos años
Mínimo:
1.87 bn
1 ene 1976 año
Máximo:
161.573 bn
1 ene 2015 año
A la fecha de observación
Valor
Cambio absoluto
El cambio con respecto al valor anterior
1 ene 1976 año
1.87 bn
+1.87 bn
0.0%
1 ene 1977 año
1.985 bn
+114.723 millones
6.13%
1 ene 1978 año
2.268 bn
+283.192 millones
14.27%
1 ene 1979 año
2.846 bn
+577.991 millones
25.48%
1 ene 1980 año
3.857 bn
+1.011 bn
35.52%
1 ene 1981 año
5.094 bn
+1.237 bn
32.07%
1 ene 1982 año
5.437 bn
+342.68 millones
6.73%
1 ene 1983 año
5.669 bn
+231.884 millones
4.27%
1 ene 1984 año
5.934 bn
+264.907 millones
4.67%
1 ene 1985 año
6.078 bn
+144.699 millones
2.44%
1 ene 1986 año
6.482 bn
+403.887 millones
6.64%
1 ene 1987 año
6.634 bn
+152.225 millones
2.35%
1 ene 1988 año
7.448 bn
+813.156 millones
12.26%
1 ene 1989 año
8.487 bn
+1.04 bn
13.96%
1 ene 1990 año
9.394 bn
+907.037 millones
10.69%
1 ene 1991 año
10.072 bn
+677.344 millones
7.21%
1 ene 1992 año
10.316 bn
+244.558 millones
2.43%
1 ene 1993 año
11.729 bn
+1.413 bn
13.7%
1 ene 1994 año
11.673 bn
-56.099 millones
-0.48%
1 ene 1995 año
13.66 bn
+1.987 bn
17.02%
1 ene 1996 año
16.938 bn
+3.278 bn
24.0%
1 ene 1997 año
18.004 bn
+1.066 bn
6.29%
1 ene 1998 año
18.685 bn
+681.403 millones
3.78%
1 ene 1999 año
20.333 bn
+1.648 bn
8.82%
1 ene 2000 año
23.307 bn
+2.974 bn
14.62%
1 ene 2001 año
25.831 bn
+2.524 bn
10.83%
1 ene 2002 año
26.895 bn
+1.064 bn
4.12%
1 ene 2003 año
27.515 bn
+620.24 millones
2.31%
1 ene 2004 año
33.089 bn
+5.574 bn
20.26%
1 ene 2005 año
46.903 bn
+13.813 bn
41.75%
1 ene 2006 año
62.036 bn
+15.133 bn
32.27%
1 ene 2007 año
75.398 bn
+13.362 bn
21.54%
1 ene 2008 año
89.096 bn
+13.698 bn
18.17%
1 ene 2009 año
109.572 bn
+20.476 bn
22.98%
1 ene 2010 año
94.944 bn
-14.629 bn
-13.35%
1 ene 2011 año
132.255 bn
+37.311 bn
39.3%
1 ene 2012 año
146.044 bn
+13.789 bn
10.43%
1 ene 2013 año
150.275 bn
+4.23 bn
2.9%
1 ene 2014 año
148.215 bn
-2.06 bn
-1.37%
1 ene 2015 año
161.573 bn
+13.358 bn
9.01%
Ranking de los países por los datos estadísticos actuales


Comentarios: