29
/es/
es
AIzaSyAYiBZKx7MnpbEhh9jyipgxe19OcubqV5w
April 1, 2024
38586
IDA blend
IDB
false
2
1
Service imports (BoP, current US$)
2015,2014,2013,2012,2011,2010,2009,2008,2007,2006,2005,2004,2003,2002,2001,2000,1999,1998,1997,1996,1995,1994,1993,1992,1991,1990,1989,1988,1987,1986,1985,1984,1983,1982,1981,1980,1979,1978
Estas estadísticas en otros países:
AfghanistanAlbaniaAlgeriaAngolaAntigua and BarbudaArab WorldArgentinaArmeniaArubaAustraliaAustriaAzerbaijanBahamas, TheBahrainBangladeshBarbadosBelarusBelgiumBelizeBeninBermudaBhutanBoliviaBosnia and HerzegovinaBotswanaBrazilBrunei DarussalamBulgariaBurkina FasoBurundiCabo VerdeCambodiaCameroonCanadaCaribbean small statesCentral African RepublicCentral Europe and the BalticsChadChileChinaColombiaComorosCongo, Dem. Rep.Congo, Rep.Costa RicaCote d'IvoireCroatiaCuracaoCyprusCzech RepublicDenmarkDjiboutiDominicaDominican RepublicEarly-demographic dividendEast Asia & PacificEast Asia & Pacific (excluding high income)East Asia & Pacific (IDA & IBRD countries)EcuadorEgypt, Arab Rep.El SalvadorEquatorial GuineaEritreaEstoniaEthiopiaEuro areaEurope & Central AsiaEurope & Central Asia (excluding high income)Europe & Central Asia (IDA & IBRD countries)European UnionFaroe IslandsFijiFinlandFragile and conflict affected situationsFranceFrench PolynesiaGabonGambia, TheGeorgiaGermanyGhanaGreeceGrenadaGuatemalaGuineaGuinea-BissauGuyanaHaitiHeavily indebted poor countries (HIPC)High incomeHondurasHong Kong SAR, ChinaHungaryIBRD onlyIcelandIDA & IBRD totalIDA blendIDA onlyIDA totalIndiaIndonesiaIran, Islamic Rep.IraqIrelandIsraelItalyJamaicaJapanJordanKazakhstanKenyaKiribatiKorea, Rep.KosovoKuwaitKyrgyz RepublicLao PDRLate-demographic dividendLatin America & Caribbean Latin America & Caribbean (excluding high income)Latin America & the Caribbean (IDA & IBRD countries)LatviaLeast developed countries: UN classificationLebanonLesothoLiberiaLibyaLithuaniaLow & middle incomeLow incomeLower middle incomeLuxembourgMacao SAR, ChinaMacedonia, FYRMadagascarMalawiMalaysiaMaldivesMaliMaltaMarshall IslandsMauritaniaMauritiusMexicoMicronesia, Fed. Sts.Middle East & North Africa (excluding high income)Middle East & North Africa (IDA & IBRD countries)Middle incomeMoldovaMongoliaMontenegroMoroccoMozambiqueMyanmarNamibiaNepalNetherlandsNew CaledoniaNew ZealandNicaraguaNigerNigeriaNorth AmericaNorwayOECD membersOmanOther small statesPacific island small statesPakistanPalauPanamaPapua New GuineaParaguayPeruPhilippinesPolandPortugalPost-demographic dividendPre-demographic dividendQatarRomaniaRussian FederationRwandaSamoaSao Tome and PrincipeSaudi ArabiaSenegalSerbiaSeychellesSierra LeoneSingaporeSint Maarten (Dutch part)Slovak RepublicSloveniaSmall statesSolomon IslandsSouth AfricaSouth AsiaSouth Asia (IDA & IBRD)South SudanSpainSri LankaSt. Kitts and NevisSt. LuciaSt. Vincent and the GrenadinesSub-Saharan Africa Sub-Saharan Africa (excluding high income)Sub-Saharan Africa (IDA & IBRD countries)SudanSurinameSwazilandSwedenSwitzerlandSyrian Arab RepublicTajikistanTanzaniaThailandTimor-LesteTogoTongaTrinidad and TobagoTunisiaTurkeyTuvaluUgandaUkraineUnited KingdomUnited StatesUpper middle incomeUruguayVanuatuVenezuela, RBVietnamWest Bank and GazaWorldYemen, Rep.ZambiaZimbabwe línea de tiempo (timeline):
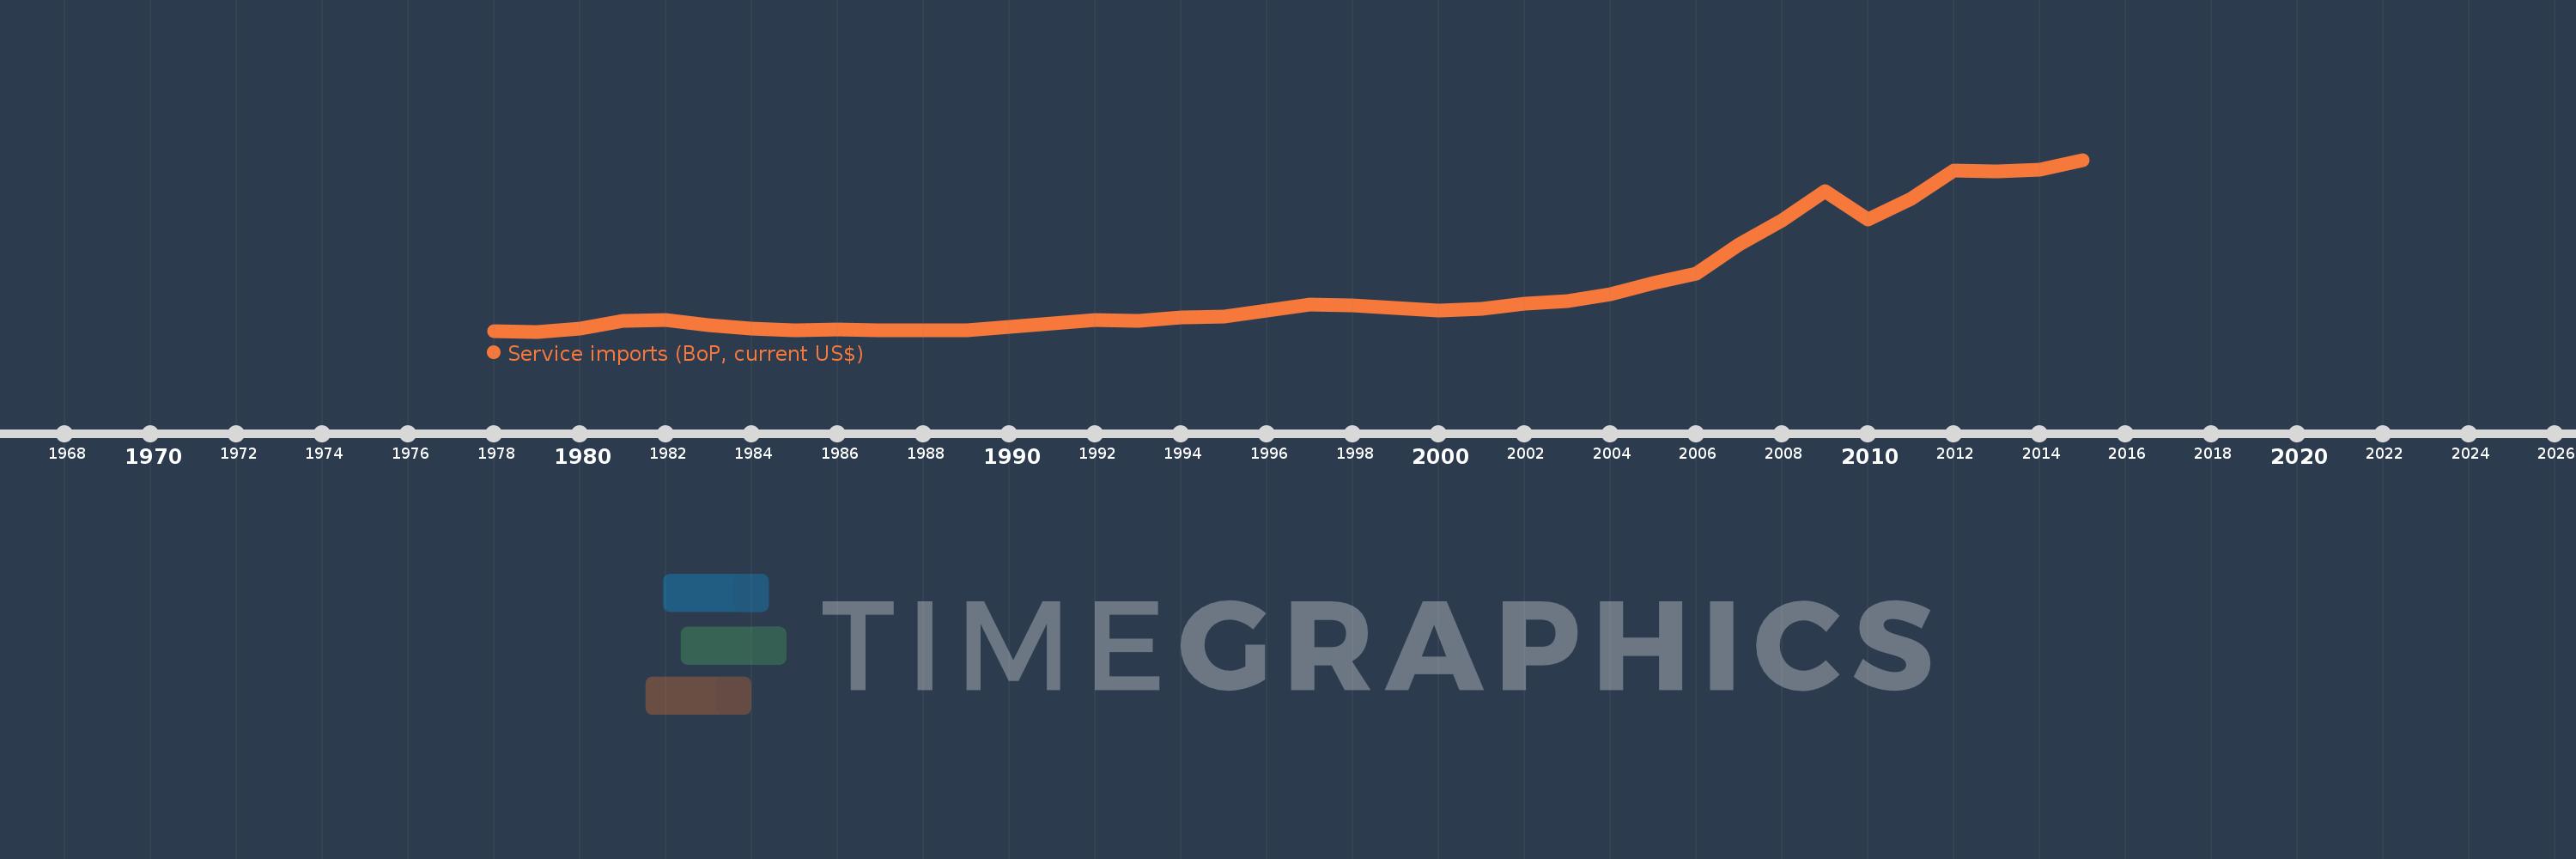
En esta escala de tiempo se presenta un gráfico de 1978 y 2015 de IDA blend. Los datos de 1977 están ausentes. El número de observaciones reales por fecha: 38.
Fuente (nombre):
Indicadores del desarrollo mundial
Fuente (organización):
International Monetary Fund, Balance of Payments Statistics Yearbook and data files.
Categorías:
Economy & Growth, Trade
Se ha actualizado:
23 abr 2017 año
Los indicadores de los cambios de valor en los últimos años
Mínimo:
5.784 bn
1 ene 1979 año
Máximo:
69.539 bn
1 ene 2015 año
A la fecha de observación
Valor
Cambio absoluto
El cambio con respecto al valor anterior
1 ene 1978 año
5.988 bn
+5.988 bn
0.0%
1 ene 1979 año
5.784 bn
-204.03 millones
-3.41%
1 ene 1980 año
6.783 bn
+999.378 millones
17.28%
1 ene 1981 año
9.71 bn
+2.926 bn
43.14%
1 ene 1982 año
10.03 bn
+320.442 millones
3.3%
1 ene 1983 año
8.167 bn
-1.863 bn
-18.58%
1 ene 1984 año
7.05 bn
-1.116 bn
-13.67%
1 ene 1985 año
6.126 bn
-924.327 millones
-13.11%
1 ene 1986 año
6.536 bn
+409.582 millones
6.69%
1 ene 1987 año
6.202 bn
-333.999 millones
-5.11%
1 ene 1988 año
6.23 bn
+28.318 millones
0.46%
1 ene 1989 año
6.414 bn
+184.196 millones
2.96%
1 ene 1990 año
7.529 bn
+1.115 bn
17.38%
1 ene 1991 año
8.951 bn
+1.422 bn
18.89%
1 ene 1992 año
10.187 bn
+1.236 bn
13.81%
1 ene 1993 año
9.889 bn
-297.999 millones
-2.93%
1 ene 1994 año
10.895 bn
+1.006 bn
10.17%
1 ene 1995 año
11.208 bn
+312.562 millones
2.87%
1 ene 1996 año
13.68 bn
+2.473 bn
22.06%
1 ene 1997 año
15.671 bn
+1.991 bn
14.55%
1 ene 1998 año
15.665 bn
-6.385 millones
-0.04%
1 ene 1999 año
14.646 bn
-1.019 bn
-6.5%
1 ene 2000 año
13.652 bn
-994.202 millones
-6.79%
1 ene 2001 año
14.226 bn
+573.871 millones
4.2%
1 ene 2002 año
16.029 bn
+1.803 bn
12.67%
1 ene 2003 año
16.974 bn
+944.897 millones
5.89%
1 ene 2004 año
19.538 bn
+2.564 bn
15.1%
1 ene 2005 año
23.836 bn
+4.299 bn
22.0%
1 ene 2006 año
27.362 bn
+3.526 bn
14.79%
1 ene 2007 año
38.282 bn
+10.92 bn
39.91%
1 ene 2008 año
47.168 bn
+8.886 bn
23.21%
1 ene 2009 año
57.975 bn
+10.808 bn
22.91%
1 ene 2010 año
47.374 bn
-10.601 bn
-18.29%
1 ene 2011 año
55.004 bn
+7.629 bn
16.1%
1 ene 2012 año
65.655 bn
+10.651 bn
19.36%
1 ene 2013 año
65.156 bn
-498.307 millones
-0.76%
1 ene 2014 año
66.017 bn
+861.037 millones
1.32%
1 ene 2015 año
69.539 bn
+3.521 bn
5.33%
Ranking de los países por los datos estadísticos actuales


Comentarios: