29
/es/
es
AIzaSyAYiBZKx7MnpbEhh9jyipgxe19OcubqV5w
April 1, 2024
156721
Indonesia
IDN
true
2
1
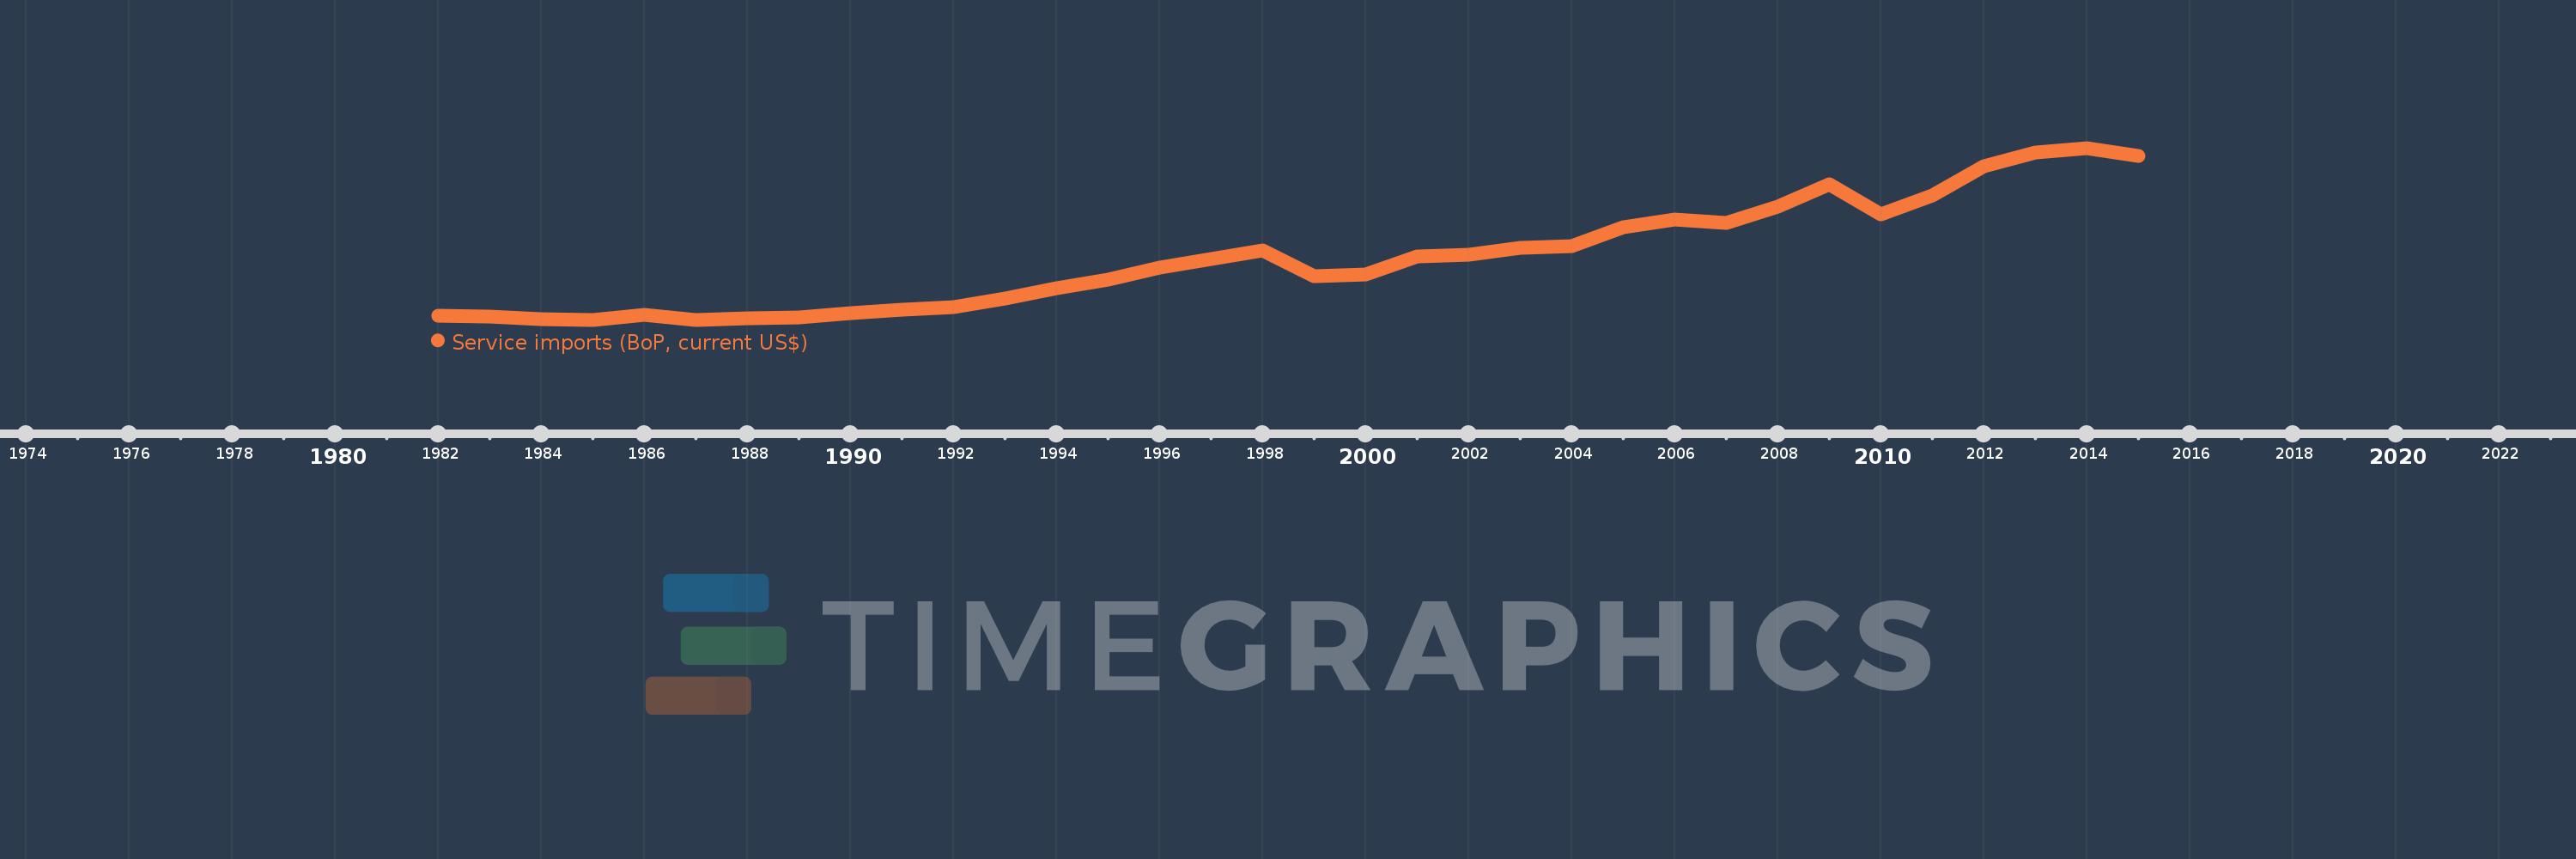
Service imports (BoP, current US$)
2015,2014,2013,2012,2011,2010,2009,2008,2007,2006,2005,2004,2003,2002,2001,2000,1999,1998,1997,1996,1995,1994,1993,1992,1991,1990,1989,1988,1987,1986,1985,1984,1983,1982
Estas estadísticas en otros países:
AfghanistanAlbaniaAlgeriaAngolaAntigua and BarbudaArab WorldArgentinaArmeniaArubaAustraliaAustriaAzerbaijanBahamas, TheBahrainBangladeshBarbadosBelarusBelgiumBelizeBeninBermudaBhutanBoliviaBosnia and HerzegovinaBotswanaBrazilBrunei DarussalamBulgariaBurkina FasoBurundiCabo VerdeCambodiaCameroonCanadaCaribbean small statesCentral African RepublicCentral Europe and the BalticsChadChileChinaColombiaComorosCongo, Dem. Rep.Congo, Rep.Costa RicaCote d'IvoireCroatiaCuracaoCyprusCzech RepublicDenmarkDjiboutiDominicaDominican RepublicEarly-demographic dividendEast Asia & PacificEast Asia & Pacific (excluding high income)East Asia & Pacific (IDA & IBRD countries)EcuadorEgypt, Arab Rep.El SalvadorEquatorial GuineaEritreaEstoniaEthiopiaEuro areaEurope & Central AsiaEurope & Central Asia (excluding high income)Europe & Central Asia (IDA & IBRD countries)European UnionFaroe IslandsFijiFinlandFragile and conflict affected situationsFranceFrench PolynesiaGabonGambia, TheGeorgiaGermanyGhanaGreeceGrenadaGuatemalaGuineaGuinea-BissauGuyanaHaitiHeavily indebted poor countries (HIPC)High incomeHondurasHong Kong SAR, ChinaHungaryIBRD onlyIcelandIDA & IBRD totalIDA blendIDA onlyIDA totalIndiaIndonesiaIran, Islamic Rep.IraqIrelandIsraelItalyJamaicaJapanJordanKazakhstanKenyaKiribatiKorea, Rep.KosovoKuwaitKyrgyz RepublicLao PDRLate-demographic dividendLatin America & Caribbean Latin America & Caribbean (excluding high income)Latin America & the Caribbean (IDA & IBRD countries)LatviaLeast developed countries: UN classificationLebanonLesothoLiberiaLibyaLithuaniaLow & middle incomeLow incomeLower middle incomeLuxembourgMacao SAR, ChinaMacedonia, FYRMadagascarMalawiMalaysiaMaldivesMaliMaltaMarshall IslandsMauritaniaMauritiusMexicoMicronesia, Fed. Sts.Middle East & North Africa (excluding high income)Middle East & North Africa (IDA & IBRD countries)Middle incomeMoldovaMongoliaMontenegroMoroccoMozambiqueMyanmarNamibiaNepalNetherlandsNew CaledoniaNew ZealandNicaraguaNigerNigeriaNorth AmericaNorwayOECD membersOmanOther small statesPacific island small statesPakistanPalauPanamaPapua New GuineaParaguayPeruPhilippinesPolandPortugalPost-demographic dividendPre-demographic dividendQatarRomaniaRussian FederationRwandaSamoaSao Tome and PrincipeSaudi ArabiaSenegalSerbiaSeychellesSierra LeoneSingaporeSint Maarten (Dutch part)Slovak RepublicSloveniaSmall statesSolomon IslandsSouth AfricaSouth AsiaSouth Asia (IDA & IBRD)South SudanSpainSri LankaSt. Kitts and NevisSt. LuciaSt. Vincent and the GrenadinesSub-Saharan Africa Sub-Saharan Africa (excluding high income)Sub-Saharan Africa (IDA & IBRD countries)SudanSurinameSwazilandSwedenSwitzerlandSyrian Arab RepublicTajikistanTanzaniaThailandTimor-LesteTogoTongaTrinidad and TobagoTunisiaTurkeyTuvaluUgandaUkraineUnited KingdomUnited StatesUpper middle incomeUruguayVanuatuVenezuela, RBVietnamWest Bank and GazaWorldYemen, Rep.ZambiaZimbabwe línea de tiempo (timeline):
En esta escala de tiempo se presenta un gráfico de 1982 y 2015 de Indonesia. Los datos de 1981 están ausentes. El número de observaciones reales por fecha: 34.
Fuente (nombre):
Indicadores del desarrollo mundial
Fuente (organización):
International Monetary Fund, Balance of Payments Statistics Yearbook and data files.
Categorías:
Economy & Growth, Trade
Se ha actualizado:
23 abr 2017 año
Los indicadores de los cambios de valor en los últimos años
Mínimo:
4.239 bn
1 ene 1985 año
Máximo:
35.015 bn
1 ene 2014 año
A la fecha de observación
Valor
Cambio absoluto
El cambio con respecto al valor anterior
1 ene 1982 año
4.998 bn
+4.998 bn
0.0%
1 ene 1983 año
4.862 bn
-136.0 millones
-2.72%
1 ene 1984 año
4.311 bn
-551.0 millones
-11.33%
1 ene 1985 año
4.239 bn
-72.0 millones
-1.67%
1 ene 1986 año
5.135 bn
+896.0 millones
21.14%
1 ene 1987 año
4.256 bn
-879.0 millones
-17.12%
1 ene 1988 año
4.44 bn
+184.0 millones
4.32%
1 ene 1989 año
4.606 bn
+166.0 millones
3.74%
1 ene 1990 año
5.439 bn
+833.0 millones
18.09%
1 ene 1991 año
6.056 bn
+617.0 millones
11.34%
1 ene 1992 año
6.564 bn
+508.0 millones
8.39%
1 ene 1993 año
8.1 bn
+1.536 bn
23.4%
1 ene 1994 año
9.846 bn
+1.746 bn
21.56%
1 ene 1995 año
11.416 bn
+1.57 bn
15.95%
1 ene 1996 año
13.54 bn
+2.124 bn
18.61%
1 ene 1997 año
15.139 bn
+1.599 bn
11.81%
1 ene 1998 año
16.607 bn
+1.468 bn
9.7%
1 ene 1999 año
12.088 bn
-4.519 bn
-27.21%
1 ene 2000 año
12.376 bn
+287.852 millones
2.38%
1 ene 2001 año
15.637 bn
+3.261 bn
26.35%
1 ene 2002 año
15.88 bn
+243.059 millones
1.55%
1 ene 2003 año
17.045 bn
+1.165 bn
7.33%
1 ene 2004 año
17.4 bn
+355.532 millones
2.09%
1 ene 2005 año
20.856 bn
+3.456 bn
19.86%
1 ene 2006 año
22.197 bn
+1.341 bn
6.43%
1 ene 2007 año
21.561 bn
-635.882 millones
-2.86%
1 ene 2008 año
24.578 bn
+3.017 bn
13.99%
1 ene 2009 año
28.47 bn
+3.892 bn
15.83%
1 ene 2010 año
23.152 bn
-5.318 bn
-18.68%
1 ene 2011 año
26.461 bn
+3.309 bn
14.29%
1 ene 2012 año
31.691 bn
+5.23 bn
19.77%
1 ene 2013 año
34.224 bn
+2.533 bn
7.99%
1 ene 2014 año
35.015 bn
+790.132 millones
2.31%
1 ene 2015 año
33.541 bn
-1.474 bn
-4.21%
Ranking de los países por los datos estadísticos actuales


Comentarios: