29
/es/
es
AIzaSyAYiBZKx7MnpbEhh9jyipgxe19OcubqV5w
April 1, 2024
41917
Latin America & Caribbean
LCN
false
2
1
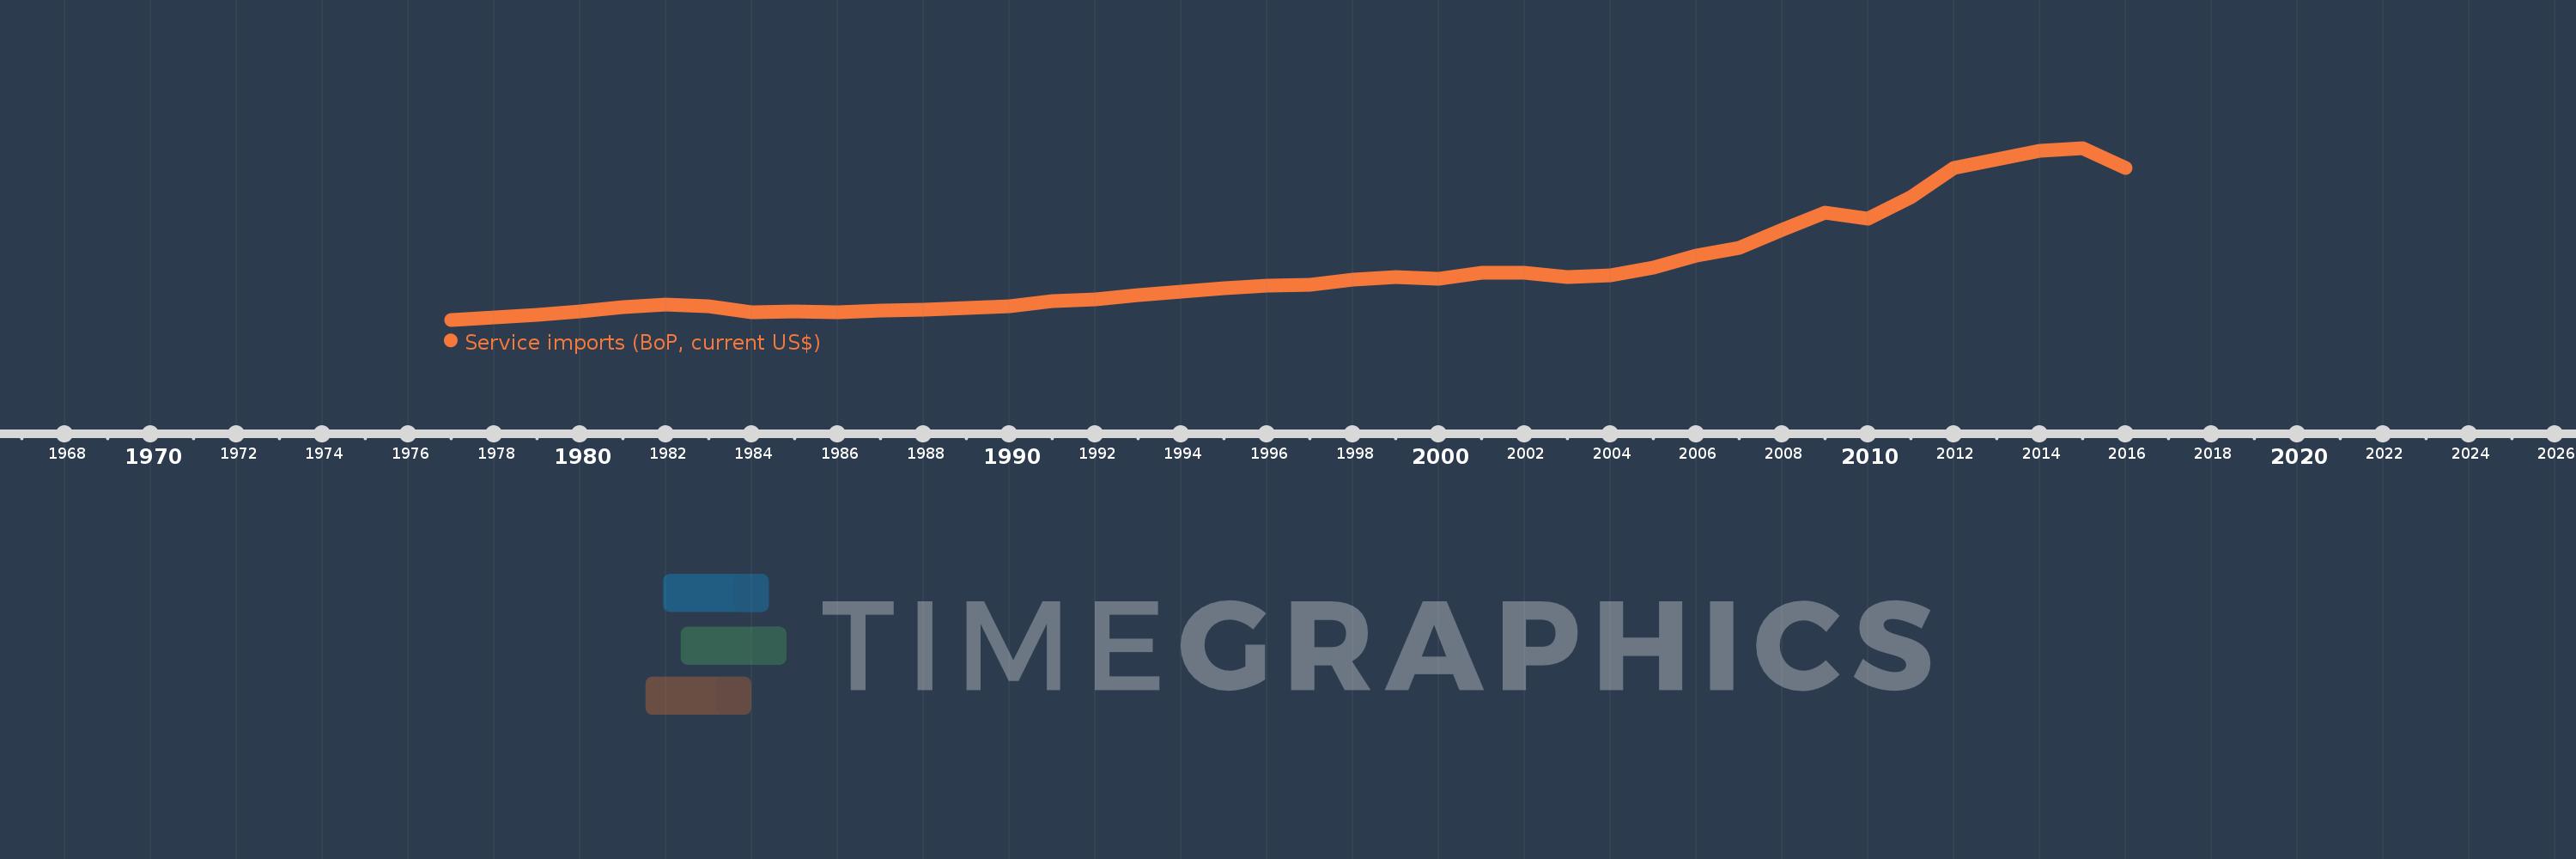
Service imports (BoP, current US$)
2016,2015,2014,2013,2012,2011,2010,2009,2008,2007,2006,2005,2004,2003,2002,2001,2000,1999,1998,1997,1996,1995,1994,1993,1992,1991,1990,1989,1988,1987,1986,1985,1984,1983,1982,1981,1980,1979,1978,1977
Estas estadísticas en otros países:
AfghanistanAlbaniaAlgeriaAngolaAntigua and BarbudaArab WorldArgentinaArmeniaArubaAustraliaAustriaAzerbaijanBahamas, TheBahrainBangladeshBarbadosBelarusBelgiumBelizeBeninBermudaBhutanBoliviaBosnia and HerzegovinaBotswanaBrazilBrunei DarussalamBulgariaBurkina FasoBurundiCabo VerdeCambodiaCameroonCanadaCaribbean small statesCentral African RepublicCentral Europe and the BalticsChadChileChinaColombiaComorosCongo, Dem. Rep.Congo, Rep.Costa RicaCote d'IvoireCroatiaCuracaoCyprusCzech RepublicDenmarkDjiboutiDominicaDominican RepublicEarly-demographic dividendEast Asia & PacificEast Asia & Pacific (excluding high income)East Asia & Pacific (IDA & IBRD countries)EcuadorEgypt, Arab Rep.El SalvadorEquatorial GuineaEritreaEstoniaEthiopiaEuro areaEurope & Central AsiaEurope & Central Asia (excluding high income)Europe & Central Asia (IDA & IBRD countries)European UnionFaroe IslandsFijiFinlandFragile and conflict affected situationsFranceFrench PolynesiaGabonGambia, TheGeorgiaGermanyGhanaGreeceGrenadaGuatemalaGuineaGuinea-BissauGuyanaHaitiHeavily indebted poor countries (HIPC)High incomeHondurasHong Kong SAR, ChinaHungaryIBRD onlyIcelandIDA & IBRD totalIDA blendIDA onlyIDA totalIndiaIndonesiaIran, Islamic Rep.IraqIrelandIsraelItalyJamaicaJapanJordanKazakhstanKenyaKiribatiKorea, Rep.KosovoKuwaitKyrgyz RepublicLao PDRLate-demographic dividendLatin America & Caribbean Latin America & Caribbean (excluding high income)Latin America & the Caribbean (IDA & IBRD countries)LatviaLeast developed countries: UN classificationLebanonLesothoLiberiaLibyaLithuaniaLow & middle incomeLow incomeLower middle incomeLuxembourgMacao SAR, ChinaMacedonia, FYRMadagascarMalawiMalaysiaMaldivesMaliMaltaMarshall IslandsMauritaniaMauritiusMexicoMicronesia, Fed. Sts.Middle East & North Africa (excluding high income)Middle East & North Africa (IDA & IBRD countries)Middle incomeMoldovaMongoliaMontenegroMoroccoMozambiqueMyanmarNamibiaNepalNetherlandsNew CaledoniaNew ZealandNicaraguaNigerNigeriaNorth AmericaNorwayOECD membersOmanOther small statesPacific island small statesPakistanPalauPanamaPapua New GuineaParaguayPeruPhilippinesPolandPortugalPost-demographic dividendPre-demographic dividendQatarRomaniaRussian FederationRwandaSamoaSao Tome and PrincipeSaudi ArabiaSenegalSerbiaSeychellesSierra LeoneSingaporeSint Maarten (Dutch part)Slovak RepublicSloveniaSmall statesSolomon IslandsSouth AfricaSouth AsiaSouth Asia (IDA & IBRD)South SudanSpainSri LankaSt. Kitts and NevisSt. LuciaSt. Vincent and the GrenadinesSub-Saharan Africa Sub-Saharan Africa (excluding high income)Sub-Saharan Africa (IDA & IBRD countries)SudanSurinameSwazilandSwedenSwitzerlandSyrian Arab RepublicTajikistanTanzaniaThailandTimor-LesteTogoTongaTrinidad and TobagoTunisiaTurkeyTuvaluUgandaUkraineUnited KingdomUnited StatesUpper middle incomeUruguayVanuatuVenezuela, RBVietnamWest Bank and GazaWorldYemen, Rep.ZambiaZimbabwe línea de tiempo (timeline):
En esta escala de tiempo se presenta un gráfico de 1977 y 2016 de Latin America & Caribbean . Los datos de 1976 están ausentes. El número de observaciones reales por fecha: 40.
Fuente (nombre):
Indicadores del desarrollo mundial
Fuente (organización):
International Monetary Fund, Balance of Payments Statistics Yearbook and data files.
Categorías:
Economy & Growth, Trade
Se ha actualizado:
23 abr 2017 año
Los indicadores de los cambios de valor en los últimos años
Mínimo:
13.475 bn
1 ene 1977 año
Máximo:
254.235 bn
1 ene 2015 año
A la fecha de observación
Valor
Cambio absoluto
El cambio con respecto al valor anterior
1 ene 1977 año
13.475 bn
+13.475 bn
0.0%
1 ene 1978 año
16.704 bn
+3.229 bn
23.96%
1 ene 1979 año
19.977 bn
+3.272 bn
19.59%
1 ene 1980 año
24.988 bn
+5.011 bn
25.09%
1 ene 1981 año
31.29 bn
+6.302 bn
25.22%
1 ene 1982 año
35.136 bn
+3.846 bn
12.29%
1 ene 1983 año
31.913 bn
-3.223 bn
-9.17%
1 ene 1984 año
24.467 bn
-7.446 bn
-23.33%
1 ene 1985 año
24.785 bn
+318.638 millones
1.3%
1 ene 1986 año
24.546 bn
-239.264 millones
-0.97%
1 ene 1987 año
26.358 bn
+1.812 bn
7.38%
1 ene 1988 año
27.087 bn
+728.354 millones
2.76%
1 ene 1989 año
30.413 bn
+3.326 bn
12.28%
1 ene 1990 año
32.876 bn
+2.463 bn
8.1%
1 ene 1991 año
39.025 bn
+6.15 bn
18.71%
1 ene 1992 año
41.895 bn
+2.87 bn
7.35%
1 ene 1993 año
47.558 bn
+5.663 bn
13.52%
1 ene 1994 año
52.963 bn
+5.405 bn
11.37%
1 ene 1995 año
57.487 bn
+4.523 bn
8.54%
1 ene 1996 año
61.043 bn
+3.556 bn
6.19%
1 ene 1997 año
62.899 bn
+1.856 bn
3.04%
1 ene 1998 año
69.885 bn
+6.985 bn
11.11%
1 ene 1999 año
73.463 bn
+3.578 bn
5.12%
1 ene 2000 año
70.591 bn
-2.871 bn
-3.91%
1 ene 2001 año
78.738 bn
+8.146 bn
11.54%
1 ene 2002 año
78.994 bn
+255.882 millones
0.32%
1 ene 2003 año
72.937 bn
-6.057 bn
-7.67%
1 ene 2004 año
76.125 bn
+3.188 bn
4.37%
1 ene 2005 año
86.205 bn
+10.08 bn
13.24%
1 ene 2006 año
103.015 bn
+16.81 bn
19.5%
1 ene 2007 año
114.443 bn
+11.427 bn
11.09%
1 ene 2008 año
139.74 bn
+25.298 bn
22.11%
1 ene 2009 año
163.653 bn
+23.913 bn
17.11%
1 ene 2010 año
155.617 bn
-8.035 bn
-4.91%
1 ene 2011 año
185.662 bn
+30.044 bn
19.31%
1 ene 2012 año
225.793 bn
+40.131 bn
21.62%
1 ene 2013 año
238.028 bn
+12.236 bn
5.42%
1 ene 2014 año
250.602 bn
+12.574 bn
5.28%
1 ene 2015 año
254.235 bn
+3.633 bn
1.45%
1 ene 2016 año
226.133 bn
-28.102 bn
-11.05%
Ranking de los países por los datos estadísticos actuales


Comentarios: