29
/es/
es
AIzaSyAYiBZKx7MnpbEhh9jyipgxe19OcubqV5w
April 1, 2024
37002
IBRD only
IBD
false
2
1
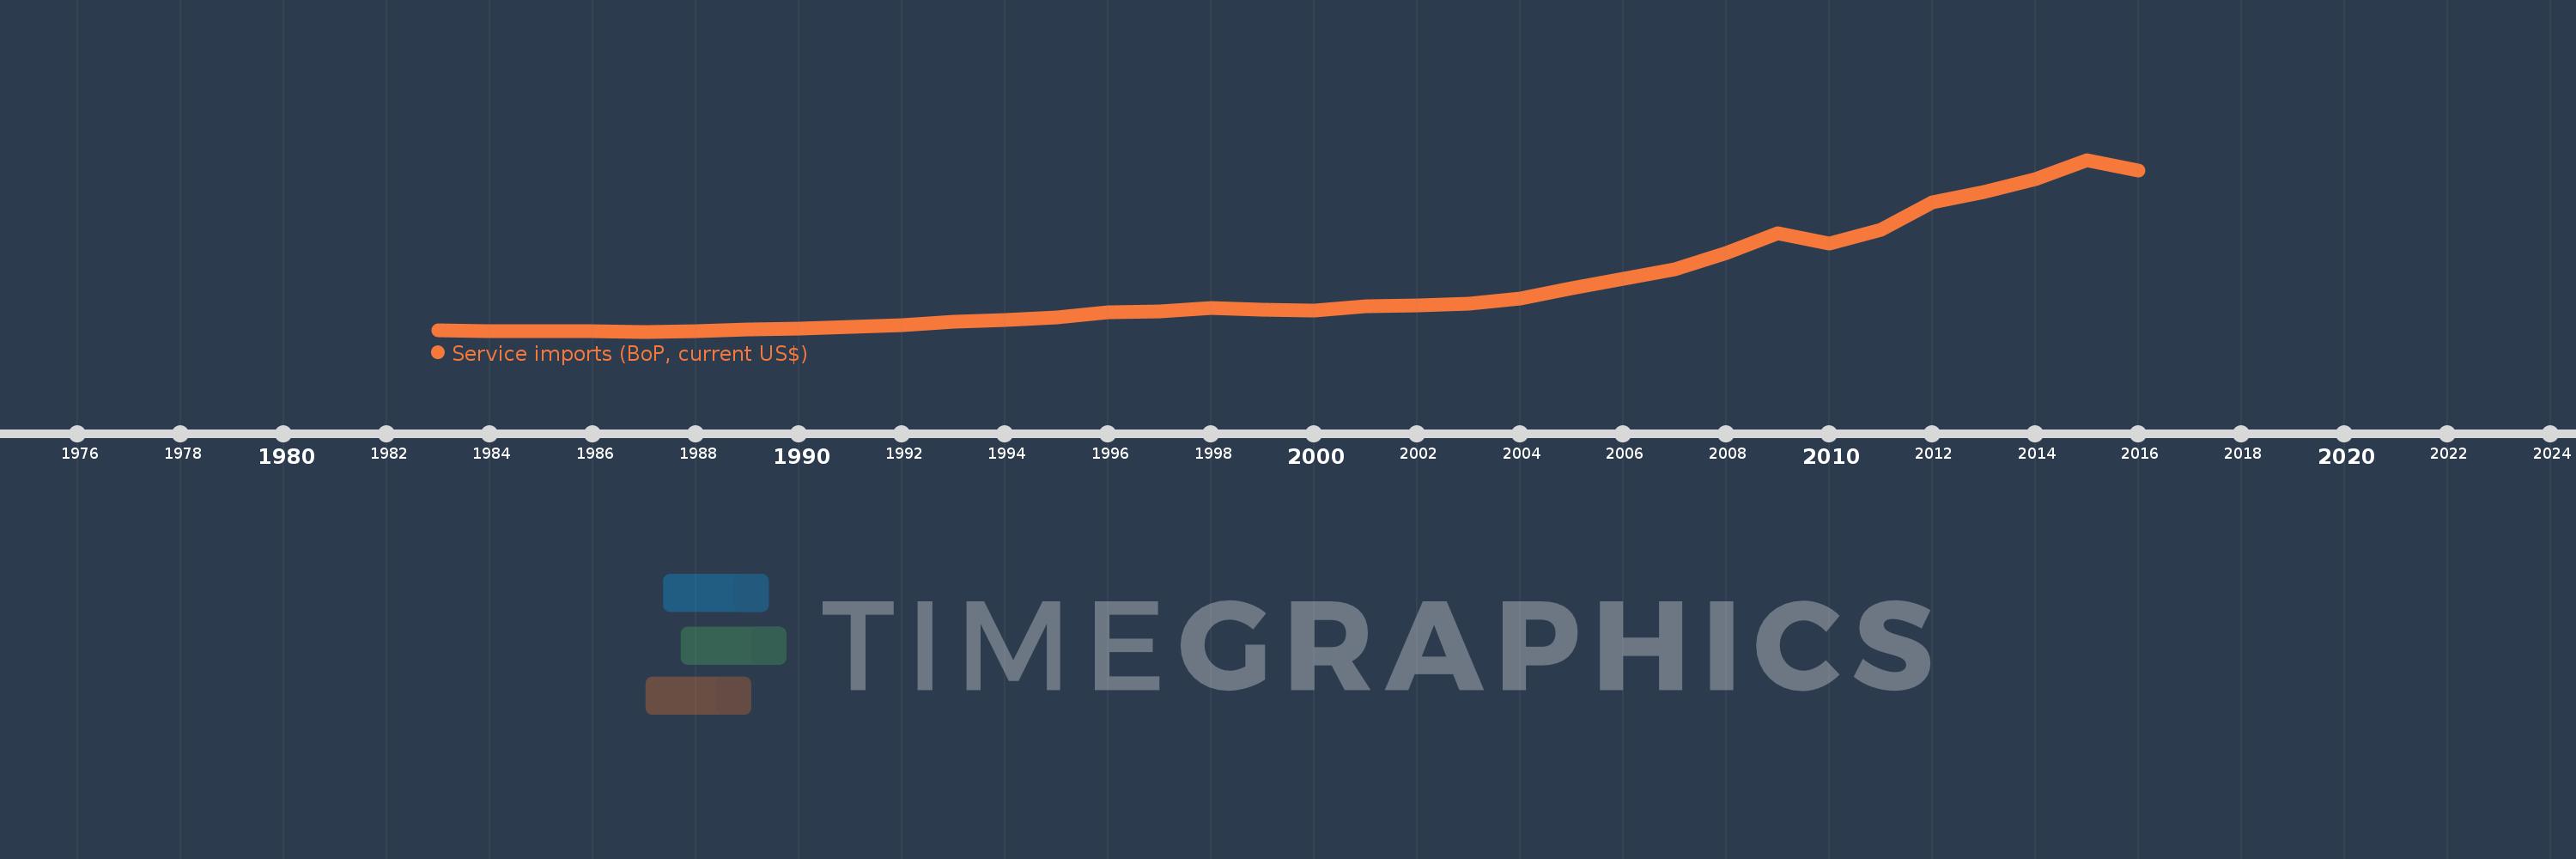
Service imports (BoP, current US$)
2016,2015,2014,2013,2012,2011,2010,2009,2008,2007,2006,2005,2004,2003,2002,2001,2000,1999,1998,1997,1996,1995,1994,1993,1992,1991,1990,1989,1988,1987,1986,1985,1984,1983
Estas estadísticas en otros países:
AfghanistanAlbaniaAlgeriaAngolaAntigua and BarbudaArab WorldArgentinaArmeniaArubaAustraliaAustriaAzerbaijanBahamas, TheBahrainBangladeshBarbadosBelarusBelgiumBelizeBeninBermudaBhutanBoliviaBosnia and HerzegovinaBotswanaBrazilBrunei DarussalamBulgariaBurkina FasoBurundiCabo VerdeCambodiaCameroonCanadaCaribbean small statesCentral African RepublicCentral Europe and the BalticsChadChileChinaColombiaComorosCongo, Dem. Rep.Congo, Rep.Costa RicaCote d'IvoireCroatiaCuracaoCyprusCzech RepublicDenmarkDjiboutiDominicaDominican RepublicEarly-demographic dividendEast Asia & PacificEast Asia & Pacific (excluding high income)East Asia & Pacific (IDA & IBRD countries)EcuadorEgypt, Arab Rep.El SalvadorEquatorial GuineaEritreaEstoniaEthiopiaEuro areaEurope & Central AsiaEurope & Central Asia (excluding high income)Europe & Central Asia (IDA & IBRD countries)European UnionFaroe IslandsFijiFinlandFragile and conflict affected situationsFranceFrench PolynesiaGabonGambia, TheGeorgiaGermanyGhanaGreeceGrenadaGuatemalaGuineaGuinea-BissauGuyanaHaitiHeavily indebted poor countries (HIPC)High incomeHondurasHong Kong SAR, ChinaHungaryIBRD onlyIcelandIDA & IBRD totalIDA blendIDA onlyIDA totalIndiaIndonesiaIran, Islamic Rep.IraqIrelandIsraelItalyJamaicaJapanJordanKazakhstanKenyaKiribatiKorea, Rep.KosovoKuwaitKyrgyz RepublicLao PDRLate-demographic dividendLatin America & Caribbean Latin America & Caribbean (excluding high income)Latin America & the Caribbean (IDA & IBRD countries)LatviaLeast developed countries: UN classificationLebanonLesothoLiberiaLibyaLithuaniaLow & middle incomeLow incomeLower middle incomeLuxembourgMacao SAR, ChinaMacedonia, FYRMadagascarMalawiMalaysiaMaldivesMaliMaltaMarshall IslandsMauritaniaMauritiusMexicoMicronesia, Fed. Sts.Middle East & North Africa (excluding high income)Middle East & North Africa (IDA & IBRD countries)Middle incomeMoldovaMongoliaMontenegroMoroccoMozambiqueMyanmarNamibiaNepalNetherlandsNew CaledoniaNew ZealandNicaraguaNigerNigeriaNorth AmericaNorwayOECD membersOmanOther small statesPacific island small statesPakistanPalauPanamaPapua New GuineaParaguayPeruPhilippinesPolandPortugalPost-demographic dividendPre-demographic dividendQatarRomaniaRussian FederationRwandaSamoaSao Tome and PrincipeSaudi ArabiaSenegalSerbiaSeychellesSierra LeoneSingaporeSint Maarten (Dutch part)Slovak RepublicSloveniaSmall statesSolomon IslandsSouth AfricaSouth AsiaSouth Asia (IDA & IBRD)South SudanSpainSri LankaSt. Kitts and NevisSt. LuciaSt. Vincent and the GrenadinesSub-Saharan Africa Sub-Saharan Africa (excluding high income)Sub-Saharan Africa (IDA & IBRD countries)SudanSurinameSwazilandSwedenSwitzerlandSyrian Arab RepublicTajikistanTanzaniaThailandTimor-LesteTogoTongaTrinidad and TobagoTunisiaTurkeyTuvaluUgandaUkraineUnited KingdomUnited StatesUpper middle incomeUruguayVanuatuVenezuela, RBVietnamWest Bank and GazaWorldYemen, Rep.ZambiaZimbabwe línea de tiempo (timeline):
En esta escala de tiempo se presenta un gráfico de 1983 y 2016 de IBRD only. Los datos de 1982 están ausentes. El número de observaciones reales por fecha: 34.
Fuente (nombre):
Indicadores del desarrollo mundial
Fuente (organización):
International Monetary Fund, Balance of Payments Statistics Yearbook and data files.
Categorías:
Economy & Growth, Trade
Se ha actualizado:
23 abr 2017 año
Los indicadores de los cambios de valor en los últimos años
Mínimo:
70.878 bn
1 ene 1987 año
Máximo:
1.383 billones
1 ene 2015 año
A la fecha de observación
Valor
Cambio absoluto
El cambio con respecto al valor anterior
1 ene 1983 año
81.174 bn
+81.174 bn
0.0%
1 ene 1984 año
74.309 bn
-6.865 bn
-8.46%
1 ene 1985 año
74.851 bn
+542.268 millones
0.73%
1 ene 1986 año
72.766 bn
-2.085 bn
-2.79%
1 ene 1987 año
70.878 bn
-1.888 bn
-2.59%
1 ene 1988 año
74.406 bn
+3.528 bn
4.98%
1 ene 1989 año
85.027 bn
+10.621 bn
14.27%
1 ene 1990 año
93.9 bn
+8.872 bn
10.43%
1 ene 1991 año
110.092 bn
+16.192 bn
17.24%
1 ene 1992 año
119.759 bn
+9.667 bn
8.78%
1 ene 1993 año
144.107 bn
+24.348 bn
20.33%
1 ene 1994 año
161.29 bn
+17.183 bn
11.92%
1 ene 1995 año
180.969 bn
+19.679 bn
12.2%
1 ene 1996 año
217.434 bn
+36.465 bn
20.15%
1 ene 1997 año
225.766 bn
+8.333 bn
3.83%
1 ene 1998 año
250.907 bn
+25.14 bn
11.14%
1 ene 1999 año
235.7 bn
-15.207 bn
-6.06%
1 ene 2000 año
233.577 bn
-2.123 bn
-0.9%
1 ene 2001 año
262.917 bn
+29.34 bn
12.56%
1 ene 2002 año
271.914 bn
+8.997 bn
3.42%
1 ene 2003 año
284.583 bn
+12.669 bn
4.66%
1 ene 2004 año
321.911 bn
+37.327 bn
13.12%
1 ene 2005 año
400.847 bn
+78.936 bn
24.52%
1 ene 2006 año
474.491 bn
+73.644 bn
18.37%
1 ene 2007 año
543.783 bn
+69.292 bn
14.6%
1 ene 2008 año
672.626 bn
+128.843 bn
23.69%
1 ene 2009 año
825.173 bn
+152.547 bn
22.68%
1 ene 2010 año
740.378 bn
-84.795 bn
-10.28%
1 ene 2011 año
848.824 bn
+108.447 bn
14.65%
1 ene 2012 año
1.057 billones
+208.57 bn
24.57%
1 ene 2013 año
1.139 billones
+81.863 bn
7.74%
1 ene 2014 año
1.238 billones
+98.856 bn
8.68%
1 ene 2015 año
1.383 billones
+145.165 bn
11.72%
1 ene 2016 año
1.304 billones
-79.557 bn
-5.75%
Ranking de los países por los datos estadísticos actuales


Comentarios: