29
/es/
es
AIzaSyAYiBZKx7MnpbEhh9jyipgxe19OcubqV5w
April 1, 2024
56157
Small states
SST
false
2
1
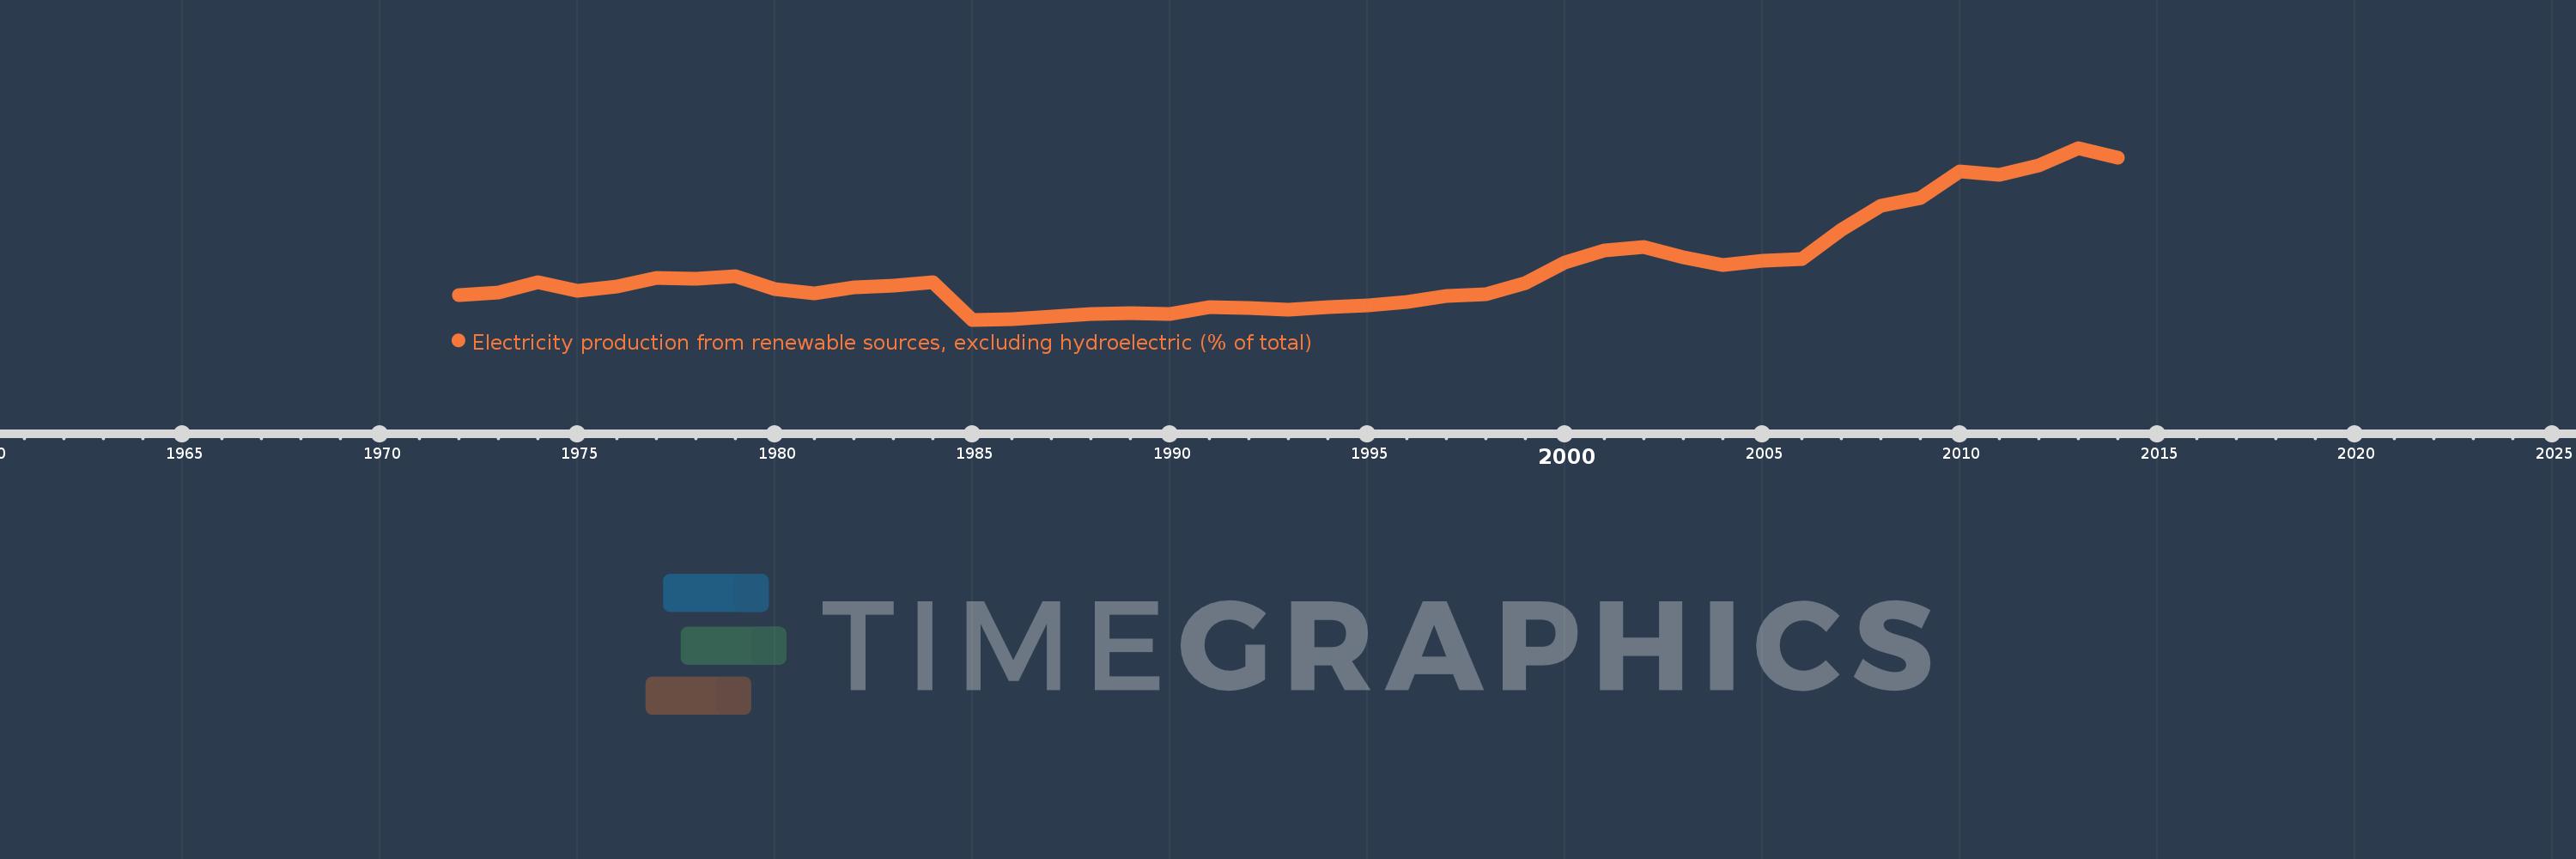
Electricity production from renewable sources, excluding hydroelectric (% of total)
2014,2013,2012,2011,2010,2009,2008,2007,2006,2005,2004,2003,2002,2001,2000,1999,1998,1997,1996,1995,1994,1993,1992,1991,1990,1989,1988,1987,1986,1985,1984,1983,1982,1981,1980,1979,1978,1977,1976,1975,1974,1973,1972
Estas estadísticas en otros países:
AlbaniaAlgeriaAngolaArab WorldArgentinaArmeniaAustraliaAustriaAzerbaijanBahrainBangladeshBelarusBelgiumBeninBoliviaBosnia and HerzegovinaBotswanaBrazilBrunei DarussalamBulgariaCambodiaCameroonCanadaCentral Europe and the BalticsChileChinaColombiaCongo, Dem. Rep.Congo, Rep.Costa RicaCote d'IvoireCroatiaCubaCuracaoCyprusCzech RepublicDenmarkDominican RepublicEarly-demographic dividendEast Asia & PacificEast Asia & Pacific (excluding high income)East Asia & Pacific (IDA & IBRD countries)EcuadorEgypt, Arab Rep.El SalvadorEritreaEstoniaEthiopiaEuro areaEurope & Central AsiaEurope & Central Asia (excluding high income)Europe & Central Asia (IDA & IBRD countries)European UnionFinlandFragile and conflict affected situationsFranceGabonGeorgiaGermanyGhanaGibraltarGreeceGuatemalaHaitiHeavily indebted poor countries (HIPC)High incomeHondurasHong Kong SAR, ChinaHungaryIBRD onlyIcelandIDA & IBRD totalIDA blendIDA onlyIDA totalIndiaIndonesiaIran, Islamic Rep.IraqIrelandIsraelItalyJamaicaJapanJordanKazakhstanKenyaKorea, Dem. People’s Rep.Korea, Rep.KosovoKuwaitKyrgyz RepublicLate-demographic dividendLatin America & Caribbean Latin America & Caribbean (excluding high income)Latin America & the Caribbean (IDA & IBRD countries)LatviaLeast developed countries: UN classificationLebanonLibyaLithuaniaLow & middle incomeLower middle incomeLuxembourgMacedonia, FYRMalaysiaMaltaMauritiusMexicoMiddle East & North AfricaMiddle East & North Africa (excluding high income)Middle East & North Africa (IDA & IBRD countries)Middle incomeMoldovaMongoliaMontenegroMoroccoMozambiqueMyanmarNamibiaNepalNetherlandsNew ZealandNicaraguaNigerNigeriaNorth AmericaNorwayOECD membersOmanOther small statesPakistanPanamaParaguayPeruPhilippinesPolandPortugalPost-demographic dividendPre-demographic dividendQatarRomaniaRussian FederationSaudi ArabiaSenegalSerbiaSingaporeSlovak RepublicSloveniaSmall statesSouth AfricaSouth AsiaSouth Asia (IDA & IBRD)South SudanSpainSri LankaSub-Saharan Africa Sub-Saharan Africa (excluding high income)Sub-Saharan Africa (IDA & IBRD countries)SudanSwedenSwitzerlandSyrian Arab RepublicTajikistanTanzaniaThailandTogoTrinidad and TobagoTunisiaTurkeyTurkmenistanUkraineUnited Arab EmiratesUnited KingdomUnited StatesUpper middle incomeUruguayUzbekistanVenezuela, RBVietnamWorldYemen, Rep.ZambiaZimbabwe línea de tiempo (timeline):
En esta escala de tiempo se presenta un gráfico de 1972 y 2014 de Small states. Los datos de 1971 están ausentes. El número de observaciones reales por fecha: 43.
Fuente (nombre):
Indicadores del desarrollo mundial
Fuente (organización):
IEA Statistics © OECD/IEA 2014 (http://www.iea.org/stats/index.asp), subject to https://www.iea.org/t&c/termsandconditions/
Categorías:
Energy & Mining, Climate Change, Environment
Se ha actualizado:
23 abr 2017 año
Los indicadores de los cambios de valor en los últimos años
Mínimo:
0.643
1 ene 1985 año
Máximo:
5.287
1 ene 2013 año
A la fecha de observación
Valor
Cambio absoluto
El cambio con respecto al valor anterior
1 ene 1972 año
1.314
+1.314
0.0%
1 ene 1973 año
1.372
+0.058
4.44%
1 ene 1974 año
1.659
+0.287
20.92%
1 ene 1975 año
1.421
-0.238
-14.33%
1 ene 1976 año
1.535
+0.114
8.04%
1 ene 1977 año
1.775
+0.24
15.62%
1 ene 1978 año
1.741
-0.034
-1.92%
1 ene 1979 año
1.809
+0.067
3.87%
1 ene 1980 año
1.483
-0.326
-18.03%
1 ene 1981 año
1.361
-0.122
-8.22%
1 ene 1982 año
1.529
+0.168
12.38%
1 ene 1983 año
1.571
+0.041
2.71%
1 ene 1984 año
1.658
+0.087
5.56%
1 ene 1985 año
0.643
-1.015
-61.19%
1 ene 1986 año
0.665
+0.022
3.42%
1 ene 1987 año
0.738
+0.073
10.96%
1 ene 1988 año
0.804
+0.066
8.88%
1 ene 1989 año
0.812
+0.009
1.08%
1 ene 1990 año
0.794
-0.019
-2.32%
1 ene 1991 año
0.982
+0.189
23.78%
1 ene 1992 año
0.966
-0.016
-1.63%
1 ene 1993 año
0.917
-0.049
-5.06%
1 ene 1994 año
0.985
+0.068
7.39%
1 ene 1995 año
1.04
+0.055
5.55%
1 ene 1996 año
1.128
+0.088
8.51%
1 ene 1997 año
1.283
+0.155
13.73%
1 ene 1998 año
1.326
+0.043
3.35%
1 ene 1999 año
1.643
+0.317
23.91%
1 ene 2000 año
2.197
+0.553
33.68%
1 ene 2001 año
2.515
+0.319
14.51%
1 ene 2002 año
2.604
+0.088
3.5%
1 ene 2003 año
2.322
-0.281
-10.8%
1 ene 2004 año
2.129
-0.194
-8.35%
1 ene 2005 año
2.229
+0.101
4.73%
1 ene 2006 año
2.296
+0.067
3.01%
1 ene 2007 año
3.085
+0.789
34.35%
1 ene 2008 año
3.717
+0.632
20.48%
1 ene 2009 año
3.928
+0.211
5.67%
1 ene 2010 año
4.653
+0.725
18.45%
1 ene 2011 año
4.552
-0.101
-2.17%
1 ene 2012 año
4.813
+0.261
5.73%
1 ene 2013 año
5.287
+0.475
9.86%
1 ene 2014 año
5.02
-0.267
-5.05%
Ranking de los países por los datos estadísticos actuales


Comentarios: