29
/es/
es
AIzaSyAYiBZKx7MnpbEhh9jyipgxe19OcubqV5w
April 1, 2024
276547
United States
USA
true
2
1
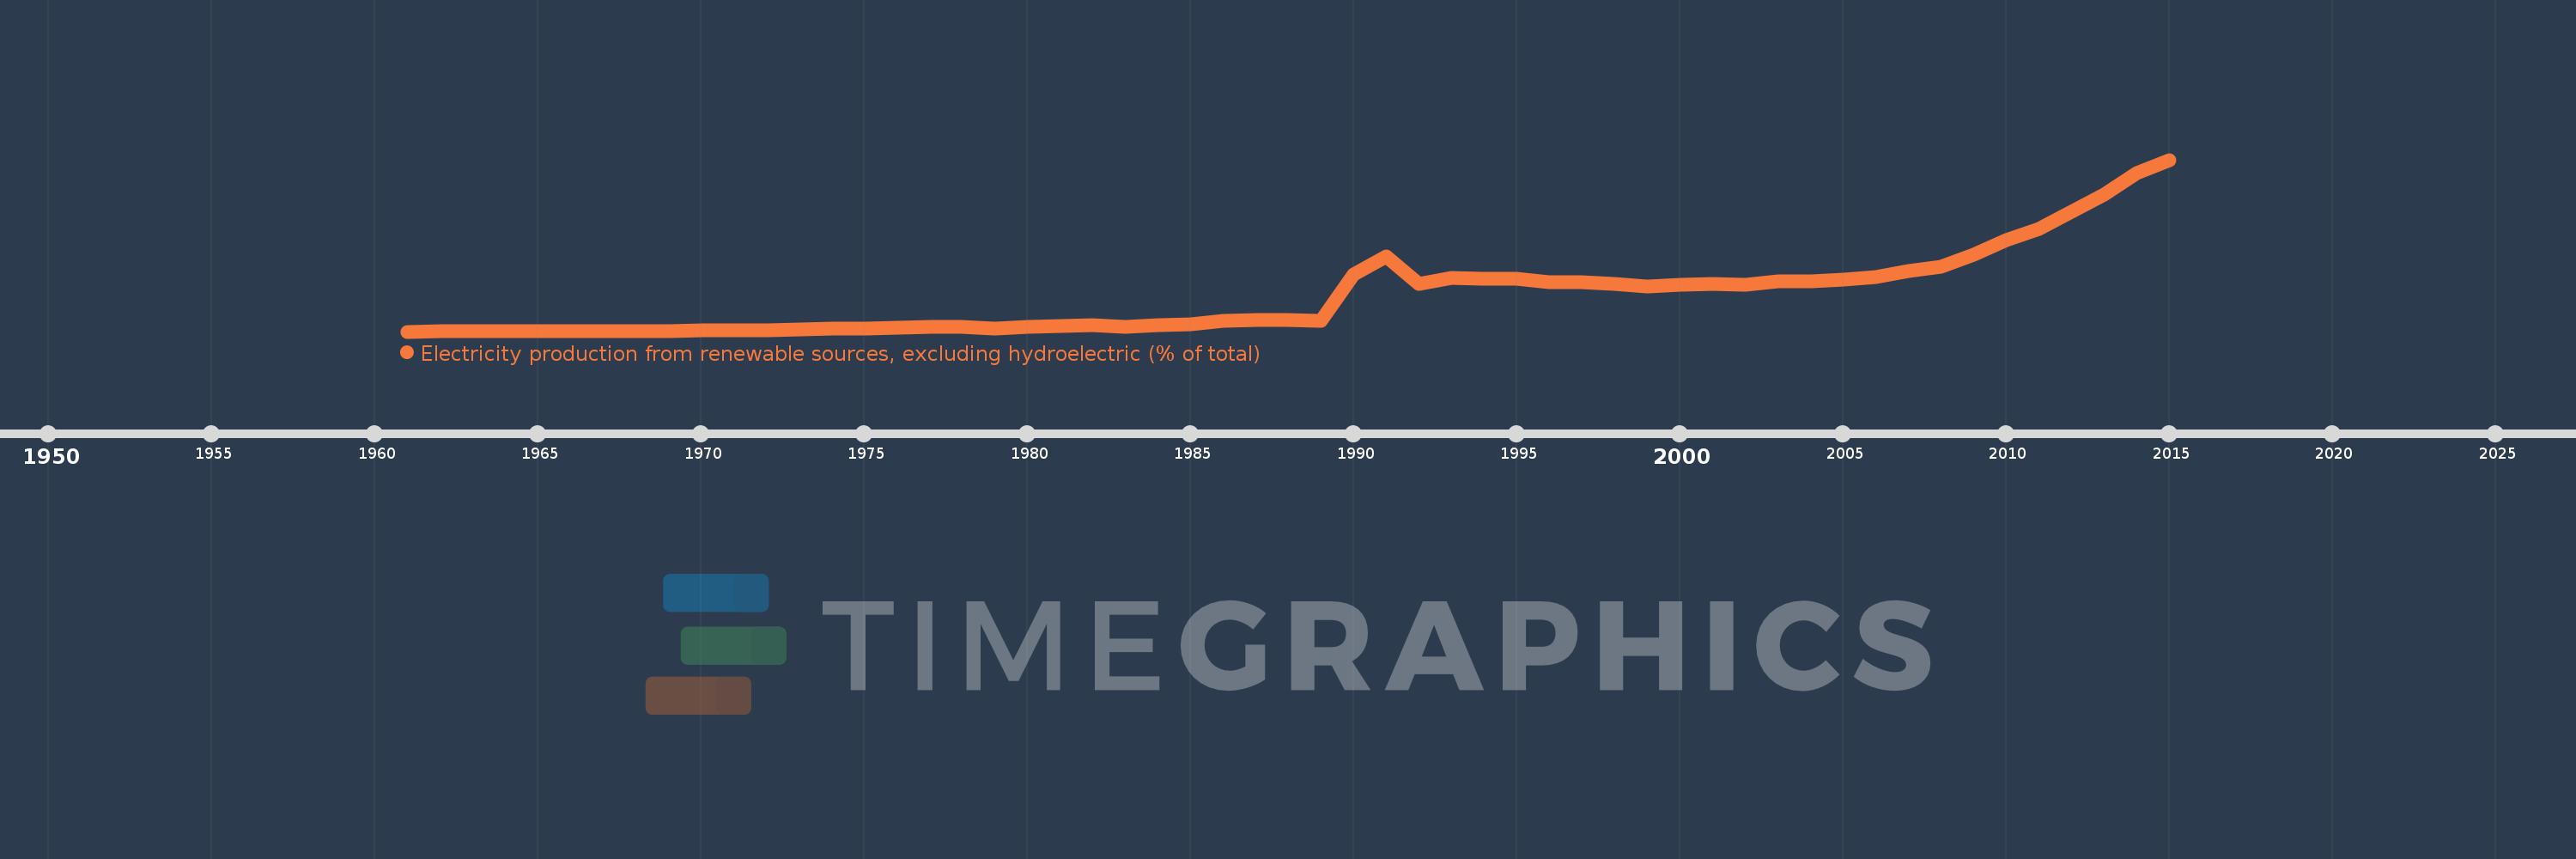
Electricity production from renewable sources, excluding hydroelectric (% of total)
2015,2014,2013,2012,2011,2010,2009,2008,2007,2006,2005,2004,2003,2002,2001,2000,1999,1998,1997,1996,1995,1994,1993,1992,1991,1990,1989,1988,1987,1986,1985,1984,1983,1982,1981,1980,1979,1978,1977,1976,1975,1974,1973,1972,1971,1970,1969,1968,1967,1966,1965,1964,1963,1962,1961
Estas estadísticas en otros países:
AlbaniaAlgeriaAngolaArab WorldArgentinaArmeniaAustraliaAustriaAzerbaijanBahrainBangladeshBelarusBelgiumBeninBoliviaBosnia and HerzegovinaBotswanaBrazilBrunei DarussalamBulgariaCambodiaCameroonCanadaCentral Europe and the BalticsChileChinaColombiaCongo, Dem. Rep.Congo, Rep.Costa RicaCote d'IvoireCroatiaCubaCuracaoCyprusCzech RepublicDenmarkDominican RepublicEarly-demographic dividendEast Asia & PacificEast Asia & Pacific (excluding high income)East Asia & Pacific (IDA & IBRD countries)EcuadorEgypt, Arab Rep.El SalvadorEritreaEstoniaEthiopiaEuro areaEurope & Central AsiaEurope & Central Asia (excluding high income)Europe & Central Asia (IDA & IBRD countries)European UnionFinlandFragile and conflict affected situationsFranceGabonGeorgiaGermanyGhanaGibraltarGreeceGuatemalaHaitiHeavily indebted poor countries (HIPC)High incomeHondurasHong Kong SAR, ChinaHungaryIBRD onlyIcelandIDA & IBRD totalIDA blendIDA onlyIDA totalIndiaIndonesiaIran, Islamic Rep.IraqIrelandIsraelItalyJamaicaJapanJordanKazakhstanKenyaKorea, Dem. People’s Rep.Korea, Rep.KosovoKuwaitKyrgyz RepublicLate-demographic dividendLatin America & Caribbean Latin America & Caribbean (excluding high income)Latin America & the Caribbean (IDA & IBRD countries)LatviaLeast developed countries: UN classificationLebanonLibyaLithuaniaLow & middle incomeLower middle incomeLuxembourgMacedonia, FYRMalaysiaMaltaMauritiusMexicoMiddle East & North AfricaMiddle East & North Africa (excluding high income)Middle East & North Africa (IDA & IBRD countries)Middle incomeMoldovaMongoliaMontenegroMoroccoMozambiqueMyanmarNamibiaNepalNetherlandsNew ZealandNicaraguaNigerNigeriaNorth AmericaNorwayOECD membersOmanOther small statesPakistanPanamaParaguayPeruPhilippinesPolandPortugalPost-demographic dividendPre-demographic dividendQatarRomaniaRussian FederationSaudi ArabiaSenegalSerbiaSingaporeSlovak RepublicSloveniaSmall statesSouth AfricaSouth AsiaSouth Asia (IDA & IBRD)South SudanSpainSri LankaSub-Saharan Africa Sub-Saharan Africa (excluding high income)Sub-Saharan Africa (IDA & IBRD countries)SudanSwedenSwitzerlandSyrian Arab RepublicTajikistanTanzaniaThailandTogoTrinidad and TobagoTunisiaTurkeyTurkmenistanUkraineUnited Arab EmiratesUnited KingdomUnited StatesUpper middle incomeUruguayUzbekistanVenezuela, RBVietnamWorldYemen, Rep.ZambiaZimbabwe línea de tiempo (timeline):
En esta escala de tiempo se presenta un gráfico de 1961 y 2015 de United States. Los datos de 1960 están ausentes. El número de observaciones reales por fecha: 55.
Fuente (nombre):
Indicadores del desarrollo mundial
Fuente (organización):
IEA Statistics © OECD/IEA 2014 (http://www.iea.org/stats/index.asp), subject to https://www.iea.org/t&c/termsandconditions/
Categorías:
Energy & Mining, Climate Change, Environment
Se ha actualizado:
23 abr 2017 año
Los indicadores de los cambios de valor en los últimos años
Mínimo:
0.015
1 ene 1961 año
Máximo:
6.858
1 ene 2015 año
A la fecha de observación
Valor
Cambio absoluto
El cambio con respecto al valor anterior
1 ene 1961 año
0.015
+0.015
0.0%
1 ene 1962 año
0.022
+0.006
41.2%
1 ene 1963 año
0.023
+0.001
5.78%
1 ene 1964 año
0.029
+0.007
29.18%
1 ene 1965 año
0.031
+0.001
4.36%
1 ene 1966 año
0.031
+0.0
0.45%
1 ene 1967 año
0.032
+0.001
2.41%
1 ene 1968 año
0.037
+0.005
16.73%
1 ene 1969 año
0.045
+0.008
21.15%
1 ene 1970 año
0.052
+0.008
17.06%
1 ene 1971 año
0.05
-0.002
-3.82%
1 ene 1972 año
0.05
-0.001
-1.52%
1 ene 1973 año
0.099
+0.05
100.39%
1 ene 1974 año
0.14
+0.041
40.81%
1 ene 1975 año
0.146
+0.007
4.66%
1 ene 1976 año
0.18
+0.034
23.22%
1 ene 1977 año
0.192
+0.011
6.29%
1 ene 1978 año
0.192
+0.0
0.18%
1 ene 1979 año
0.151
-0.041
-21.34%
1 ene 1980 año
0.196
+0.045
29.88%
1 ene 1981 año
0.239
+0.043
22.02%
1 ene 1982 año
0.263
+0.024
10.1%
1 ene 1983 año
0.216
-0.048
-18.2%
1 ene 1984 año
0.262
+0.047
21.75%
1 ene 1985 año
0.321
+0.058
22.26%
1 ene 1986 año
0.434
+0.113
35.33%
1 ene 1987 año
0.462
+0.028
6.49%
1 ene 1988 año
0.479
+0.017
3.62%
1 ene 1989 año
0.445
-0.034
-7.11%
1 ene 1990 año
2.274
+1.829
411.13%
1 ene 1991 año
3.0
+0.726
31.9%
1 ene 1992 año
1.903
-1.097
-36.57%
1 ene 1993 año
2.139
+0.236
12.39%
1 ene 1994 año
2.131
-0.007
-0.35%
1 ene 1995 año
2.135
+0.004
0.17%
1 ene 1996 año
1.974
-0.161
-7.55%
1 ene 1997 año
1.97
-0.003
-0.16%
1 ene 1998 año
1.905
-0.065
-3.32%
1 ene 1999 año
1.826
-0.079
-4.15%
1 ene 2000 año
1.895
+0.069
3.77%
1 ene 2001 año
1.917
+0.022
1.15%
1 ene 2002 año
1.88
-0.036
-1.9%
1 ene 2003 año
2.014
+0.134
7.14%
1 ene 2004 año
2.018
+0.004
0.19%
1 ene 2005 año
2.094
+0.076
3.77%
1 ene 2006 año
2.196
+0.102
4.88%
1 ene 2007 año
2.417
+0.221
10.06%
1 ene 2008 año
2.595
+0.177
7.34%
1 ene 2009 año
3.093
+0.498
19.18%
1 ene 2010 año
3.676
+0.583
18.86%
1 ene 2011 año
4.097
+0.421
11.47%
1 ene 2012 año
4.789
+0.692
16.9%
1 ene 2013 año
5.484
+0.694
14.5%
1 ene 2014 año
6.315
+0.832
15.17%
1 ene 2015 año
6.858
+0.543
8.6%
Ranking de los países por los datos estadísticos actuales


Comentarios: