29
/es/
es
AIzaSyAYiBZKx7MnpbEhh9jyipgxe19OcubqV5w
April 1, 2024
247439
Spain
ESP
true
2
1
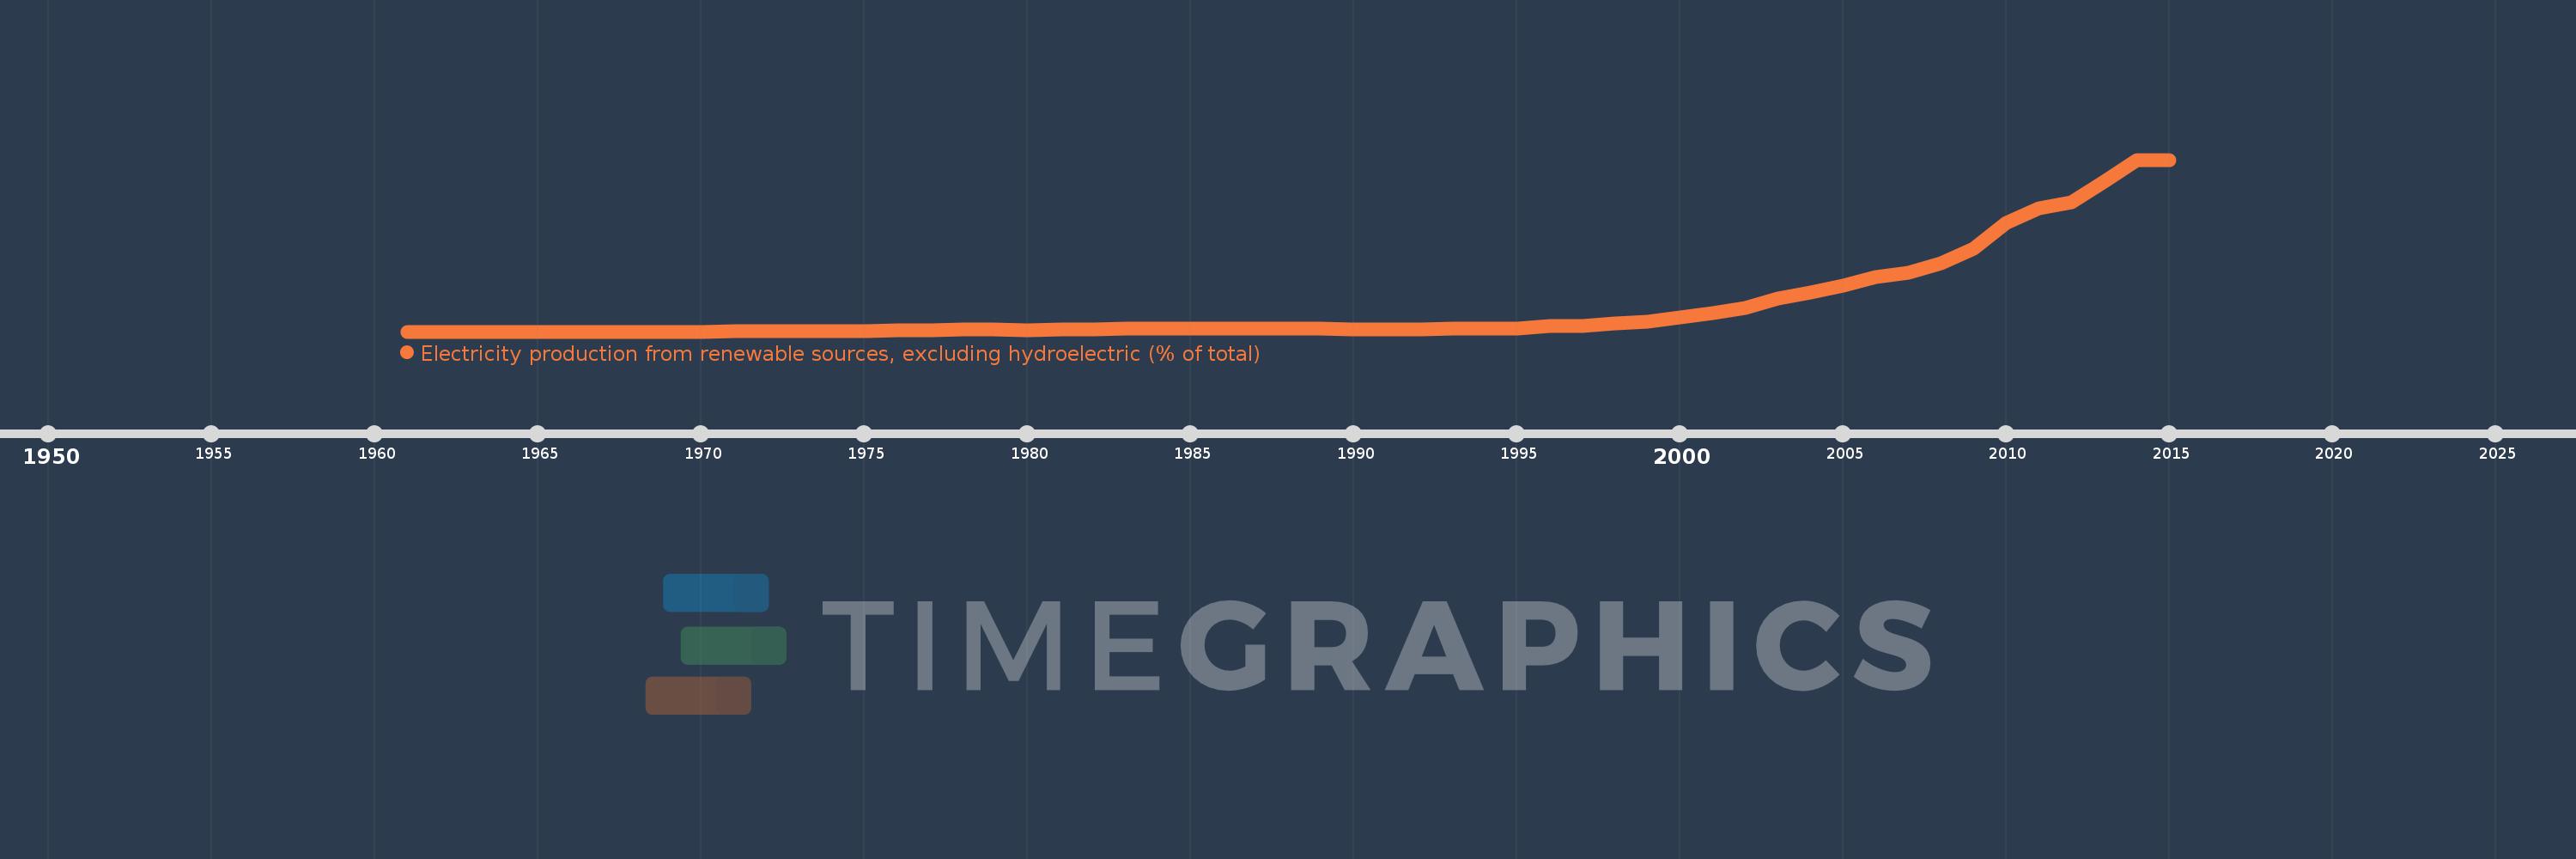
Electricity production from renewable sources, excluding hydroelectric (% of total)
2015,2014,2013,2012,2011,2010,2009,2008,2007,2006,2005,2004,2003,2002,2001,2000,1999,1998,1997,1996,1995,1994,1993,1992,1991,1990,1989,1988,1987,1986,1985,1984,1983,1982,1981,1980,1979,1978,1977,1976,1975,1974,1973,1972,1971,1970,1969,1968,1967,1966,1965,1964,1963,1962,1961
Estas estadísticas en otros países:
AlbaniaAlgeriaAngolaArab WorldArgentinaArmeniaAustraliaAustriaAzerbaijanBahrainBangladeshBelarusBelgiumBeninBoliviaBosnia and HerzegovinaBotswanaBrazilBrunei DarussalamBulgariaCambodiaCameroonCanadaCentral Europe and the BalticsChileChinaColombiaCongo, Dem. Rep.Congo, Rep.Costa RicaCote d'IvoireCroatiaCubaCuracaoCyprusCzech RepublicDenmarkDominican RepublicEarly-demographic dividendEast Asia & PacificEast Asia & Pacific (excluding high income)East Asia & Pacific (IDA & IBRD countries)EcuadorEgypt, Arab Rep.El SalvadorEritreaEstoniaEthiopiaEuro areaEurope & Central AsiaEurope & Central Asia (excluding high income)Europe & Central Asia (IDA & IBRD countries)European UnionFinlandFragile and conflict affected situationsFranceGabonGeorgiaGermanyGhanaGibraltarGreeceGuatemalaHaitiHeavily indebted poor countries (HIPC)High incomeHondurasHong Kong SAR, ChinaHungaryIBRD onlyIcelandIDA & IBRD totalIDA blendIDA onlyIDA totalIndiaIndonesiaIran, Islamic Rep.IraqIrelandIsraelItalyJamaicaJapanJordanKazakhstanKenyaKorea, Dem. People’s Rep.Korea, Rep.KosovoKuwaitKyrgyz RepublicLate-demographic dividendLatin America & Caribbean Latin America & Caribbean (excluding high income)Latin America & the Caribbean (IDA & IBRD countries)LatviaLeast developed countries: UN classificationLebanonLibyaLithuaniaLow & middle incomeLower middle incomeLuxembourgMacedonia, FYRMalaysiaMaltaMauritiusMexicoMiddle East & North AfricaMiddle East & North Africa (excluding high income)Middle East & North Africa (IDA & IBRD countries)Middle incomeMoldovaMongoliaMontenegroMoroccoMozambiqueMyanmarNamibiaNepalNetherlandsNew ZealandNicaraguaNigerNigeriaNorth AmericaNorwayOECD membersOmanOther small statesPakistanPanamaParaguayPeruPhilippinesPolandPortugalPost-demographic dividendPre-demographic dividendQatarRomaniaRussian FederationSaudi ArabiaSenegalSerbiaSingaporeSlovak RepublicSloveniaSmall statesSouth AfricaSouth AsiaSouth Asia (IDA & IBRD)South SudanSpainSri LankaSub-Saharan Africa Sub-Saharan Africa (excluding high income)Sub-Saharan Africa (IDA & IBRD countries)SudanSwedenSwitzerlandSyrian Arab RepublicTajikistanTanzaniaThailandTogoTrinidad and TobagoTunisiaTurkeyTurkmenistanUkraineUnited Arab EmiratesUnited KingdomUnited StatesUpper middle incomeUruguayUzbekistanVenezuela, RBVietnamWorldYemen, Rep.ZambiaZimbabwe línea de tiempo (timeline):
En esta escala de tiempo se presenta un gráfico de 1961 y 2015 de Spain. Los datos de 1960 están ausentes. El número de observaciones reales por fecha: 55.
Fuente (nombre):
Indicadores del desarrollo mundial
Fuente (organización):
IEA Statistics © OECD/IEA 2014 (http://www.iea.org/stats/index.asp), subject to https://www.iea.org/t&c/termsandconditions/
Categorías:
Energy & Mining, Climate Change, Environment
Se ha actualizado:
23 abr 2017 año
Los indicadores de los cambios de valor en los últimos años
Máximo:
25.87
1 ene 2015 año
A la fecha de observación
Valor
Cambio absoluto
El cambio con respecto al valor anterior
1 ene 1961 año
0.0
0.0
0.0%
1 ene 1971 año
0.083
+0.083
%
1 ene 1972 año
0.084
+0.001
1.15%
1 ene 1973 año
0.09
+0.005
6.37%
1 ene 1974 año
0.074
-0.016
-17.59%
1 ene 1975 año
0.064
-0.01
-13.95%
1 ene 1976 año
0.138
+0.074
116.11%
1 ene 1977 año
0.21
+0.072
52.23%
1 ene 1978 año
0.333
+0.124
59.1%
1 ene 1979 año
0.322
-0.012
-3.56%
1 ene 1980 año
0.24
-0.082
-25.44%
1 ene 1981 año
0.331
+0.092
38.25%
1 ene 1982 año
0.385
+0.054
16.31%
1 ene 1983 año
0.429
+0.044
11.31%
1 ene 1984 año
0.485
+0.056
13.12%
1 ene 1985 año
0.466
-0.02
-4.05%
1 ene 1986 año
0.486
+0.021
4.45%
1 ene 1987 año
0.42
-0.067
-13.74%
1 ene 1988 año
0.425
+0.005
1.19%
1 ene 1989 año
0.486
+0.061
14.38%
1 ene 1990 año
0.368
-0.118
-24.32%
1 ene 1991 año
0.372
+0.004
1.13%
1 ene 1992 año
0.364
-0.007
-1.94%
1 ene 1993 año
0.438
+0.073
20.12%
1 ene 1994 año
0.453
+0.015
3.46%
1 ene 1995 año
0.512
+0.059
13.07%
1 ene 1996 año
0.783
+0.271
52.82%
1 ene 1997 año
0.842
+0.059
7.53%
1 ene 1998 año
1.173
+0.331
39.34%
1 ene 1999 año
1.499
+0.326
27.79%
1 ene 2000 año
2.179
+0.68
45.4%
1 ene 2001 año
2.824
+0.645
29.59%
1 ene 2002 año
3.61
+0.786
27.85%
1 ene 2003 año
4.984
+1.374
38.06%
1 ene 2004 año
5.946
+0.962
19.3%
1 ene 2005 año
6.899
+0.953
16.02%
1 ene 2006 año
8.247
+1.348
19.54%
1 ene 2007 año
8.86
+0.614
7.44%
1 ene 2008 año
10.262
+1.401
15.81%
1 ene 2009 año
12.47
+2.208
21.52%
1 ene 2010 año
16.332
+3.862
30.97%
1 ene 2011 año
18.595
+2.262
13.85%
1 ene 2012 año
19.527
+0.932
5.01%
1 ene 2013 año
22.595
+3.068
15.71%
1 ene 2014 año
25.741
+3.145
13.92%
1 ene 2015 año
25.87
+0.129
0.5%
Ranking de los países por los datos estadísticos actuales


Comentarios: