29
/es/
es
AIzaSyAYiBZKx7MnpbEhh9jyipgxe19OcubqV5w
April 1, 2024
224739
Poland
POL
true
2
1
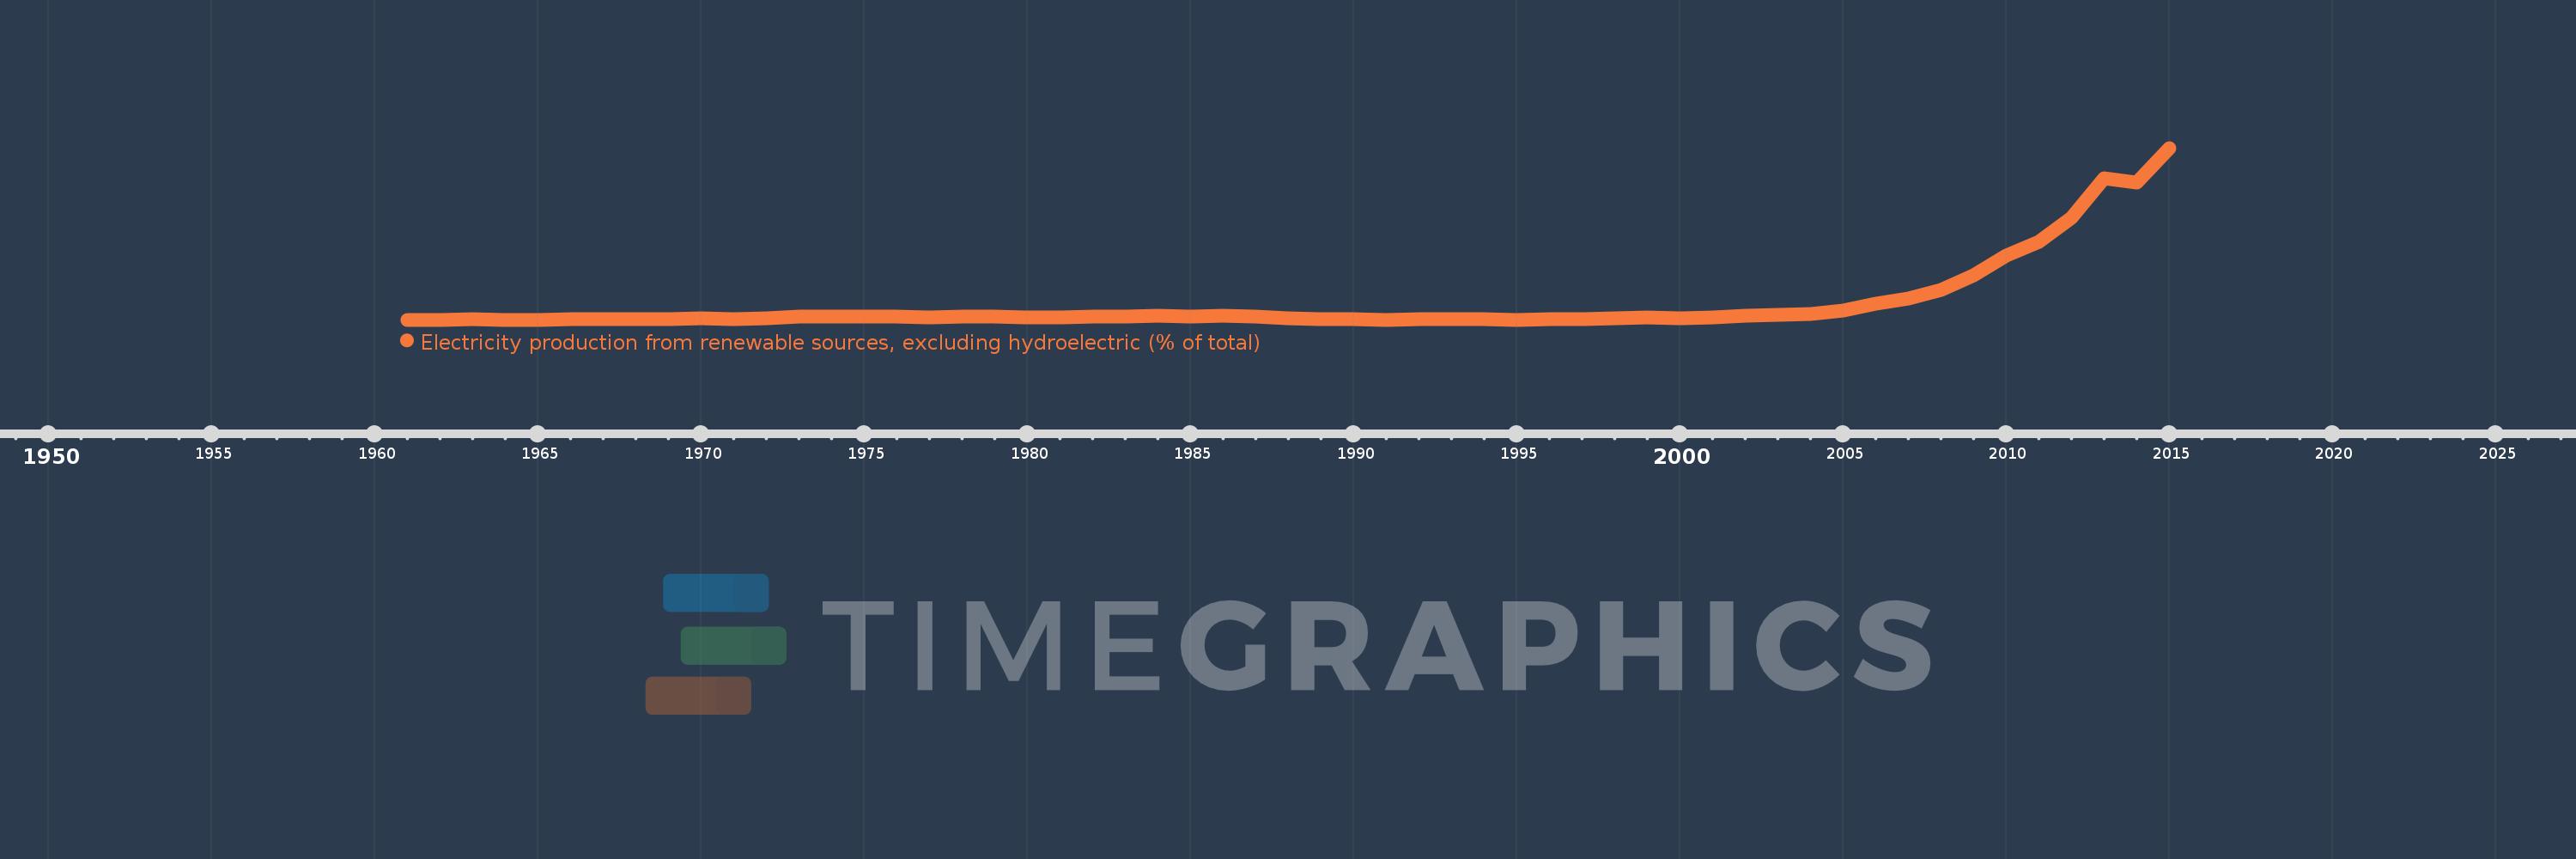
Electricity production from renewable sources, excluding hydroelectric (% of total)
2015,2014,2013,2012,2011,2010,2009,2008,2007,2006,2005,2004,2003,2002,2001,2000,1999,1998,1997,1996,1995,1994,1993,1992,1991,1990,1989,1988,1987,1986,1985,1984,1983,1982,1981,1980,1979,1978,1977,1976,1975,1974,1973,1972,1971,1970,1969,1968,1967,1966,1965,1964,1963,1962,1961
Estas estadísticas en otros países:
AlbaniaAlgeriaAngolaArab WorldArgentinaArmeniaAustraliaAustriaAzerbaijanBahrainBangladeshBelarusBelgiumBeninBoliviaBosnia and HerzegovinaBotswanaBrazilBrunei DarussalamBulgariaCambodiaCameroonCanadaCentral Europe and the BalticsChileChinaColombiaCongo, Dem. Rep.Congo, Rep.Costa RicaCote d'IvoireCroatiaCubaCuracaoCyprusCzech RepublicDenmarkDominican RepublicEarly-demographic dividendEast Asia & PacificEast Asia & Pacific (excluding high income)East Asia & Pacific (IDA & IBRD countries)EcuadorEgypt, Arab Rep.El SalvadorEritreaEstoniaEthiopiaEuro areaEurope & Central AsiaEurope & Central Asia (excluding high income)Europe & Central Asia (IDA & IBRD countries)European UnionFinlandFragile and conflict affected situationsFranceGabonGeorgiaGermanyGhanaGibraltarGreeceGuatemalaHaitiHeavily indebted poor countries (HIPC)High incomeHondurasHong Kong SAR, ChinaHungaryIBRD onlyIcelandIDA & IBRD totalIDA blendIDA onlyIDA totalIndiaIndonesiaIran, Islamic Rep.IraqIrelandIsraelItalyJamaicaJapanJordanKazakhstanKenyaKorea, Dem. People’s Rep.Korea, Rep.KosovoKuwaitKyrgyz RepublicLate-demographic dividendLatin America & Caribbean Latin America & Caribbean (excluding high income)Latin America & the Caribbean (IDA & IBRD countries)LatviaLeast developed countries: UN classificationLebanonLibyaLithuaniaLow & middle incomeLower middle incomeLuxembourgMacedonia, FYRMalaysiaMaltaMauritiusMexicoMiddle East & North AfricaMiddle East & North Africa (excluding high income)Middle East & North Africa (IDA & IBRD countries)Middle incomeMoldovaMongoliaMontenegroMoroccoMozambiqueMyanmarNamibiaNepalNetherlandsNew ZealandNicaraguaNigerNigeriaNorth AmericaNorwayOECD membersOmanOther small statesPakistanPanamaParaguayPeruPhilippinesPolandPortugalPost-demographic dividendPre-demographic dividendQatarRomaniaRussian FederationSaudi ArabiaSenegalSerbiaSingaporeSlovak RepublicSloveniaSmall statesSouth AfricaSouth AsiaSouth Asia (IDA & IBRD)South SudanSpainSri LankaSub-Saharan Africa Sub-Saharan Africa (excluding high income)Sub-Saharan Africa (IDA & IBRD countries)SudanSwedenSwitzerlandSyrian Arab RepublicTajikistanTanzaniaThailandTogoTrinidad and TobagoTunisiaTurkeyTurkmenistanUkraineUnited Arab EmiratesUnited KingdomUnited StatesUpper middle incomeUruguayUzbekistanVenezuela, RBVietnamWorldYemen, Rep.ZambiaZimbabwe línea de tiempo (timeline):
En esta escala de tiempo se presenta un gráfico de 1961 y 2015 de Poland. Los datos de 1960 están ausentes. El número de observaciones reales por fecha: 55.
Fuente (nombre):
Indicadores del desarrollo mundial
Fuente (organización):
IEA Statistics © OECD/IEA 2014 (http://www.iea.org/stats/index.asp), subject to https://www.iea.org/t&c/termsandconditions/
Categorías:
Energy & Mining, Climate Change, Environment
Se ha actualizado:
23 abr 2017 año
Los indicadores de los cambios de valor en los últimos años
Mínimo:
0.034
1 ene 1962 año
Máximo:
11.148
1 ene 2015 año
A la fecha de observación
Valor
Cambio absoluto
El cambio con respecto al valor anterior
1 ene 1961 año
0.034
+0.034
0.0%
1 ene 1962 año
0.034
0.0
-0.09%
1 ene 1963 año
0.051
+0.017
49.18%
1 ene 1964 año
0.038
-0.013
-25.54%
1 ene 1965 año
0.039
+0.002
4.01%
1 ene 1966 año
0.059
+0.02
50.64%
1 ene 1967 año
0.08
+0.021
35.14%
1 ene 1968 año
0.086
+0.006
7.05%
1 ene 1969 año
0.085
-0.001
-1.37%
1 ene 1970 año
0.14
+0.055
65.35%
1 ene 1971 año
0.092
-0.049
-34.63%
1 ene 1972 año
0.145
+0.054
58.58%
1 ene 1973 año
0.243
+0.098
67.49%
1 ene 1974 año
0.266
+0.022
9.24%
1 ene 1975 año
0.257
-0.008
-3.12%
1 ene 1976 año
0.218
-0.039
-15.33%
1 ene 1977 año
0.177
-0.041
-19.01%
1 ene 1978 año
0.243
+0.067
37.79%
1 ene 1979 año
0.228
-0.016
-6.45%
1 ene 1980 año
0.205
-0.022
-9.73%
1 ene 1981 año
0.205
0.0
-0.19%
1 ene 1982 año
0.236
+0.031
14.94%
1 ene 1983 año
0.231
-0.005
-2.07%
1 ene 1984 año
0.291
+0.061
26.27%
1 ene 1985 año
0.26
-0.032
-10.9%
1 ene 1986 año
0.293
+0.033
12.69%
1 ene 1987 año
0.267
-0.026
-8.91%
1 ene 1988 año
0.135
-0.132
-49.52%
1 ene 1989 año
0.066
-0.068
-50.79%
1 ene 1990 año
0.072
+0.006
8.54%
1 ene 1991 año
0.041
-0.031
-43.06%
1 ene 1992 año
0.063
+0.022
52.83%
1 ene 1993 año
0.085
+0.022
35.82%
1 ene 1994 año
0.046
-0.039
-45.5%
1 ene 1995 año
0.038
-0.008
-17.34%
1 ene 1996 año
0.05
+0.011
29.69%
1 ene 1997 año
0.094
+0.045
89.84%
1 ene 1998 año
0.121
+0.027
28.81%
1 ene 1999 año
0.159
+0.038
31.15%
1 ene 2000 año
0.141
-0.018
-11.57%
1 ene 2001 año
0.158
+0.017
12.18%
1 ene 2002 año
0.319
+0.161
101.88%
1 ene 2003 año
0.342
+0.024
7.46%
1 ene 2004 año
0.386
+0.044
12.71%
1 ene 2005 año
0.651
+0.265
68.65%
1 ene 2006 año
1.059
+0.409
62.76%
1 ene 2007 año
1.399
+0.339
32.04%
1 ene 2008 año
1.939
+0.54
38.59%
1 ene 2009 año
2.88
+0.941
48.53%
1 ene 2010 año
4.171
+1.291
44.84%
1 ene 2011 año
5.072
+0.901
21.61%
1 ene 2012 año
6.625
+1.552
30.6%
1 ene 2013 año
9.178
+2.553
38.54%
1 ene 2014 año
8.92
-0.259
-2.82%
1 ene 2015 año
11.148
+2.228
24.98%
Ranking de los países por los datos estadísticos actuales


Comentarios: