29
/es/
es
AIzaSyAYiBZKx7MnpbEhh9jyipgxe19OcubqV5w
April 1, 2024
50820
Middle income
MIC
false
2
1
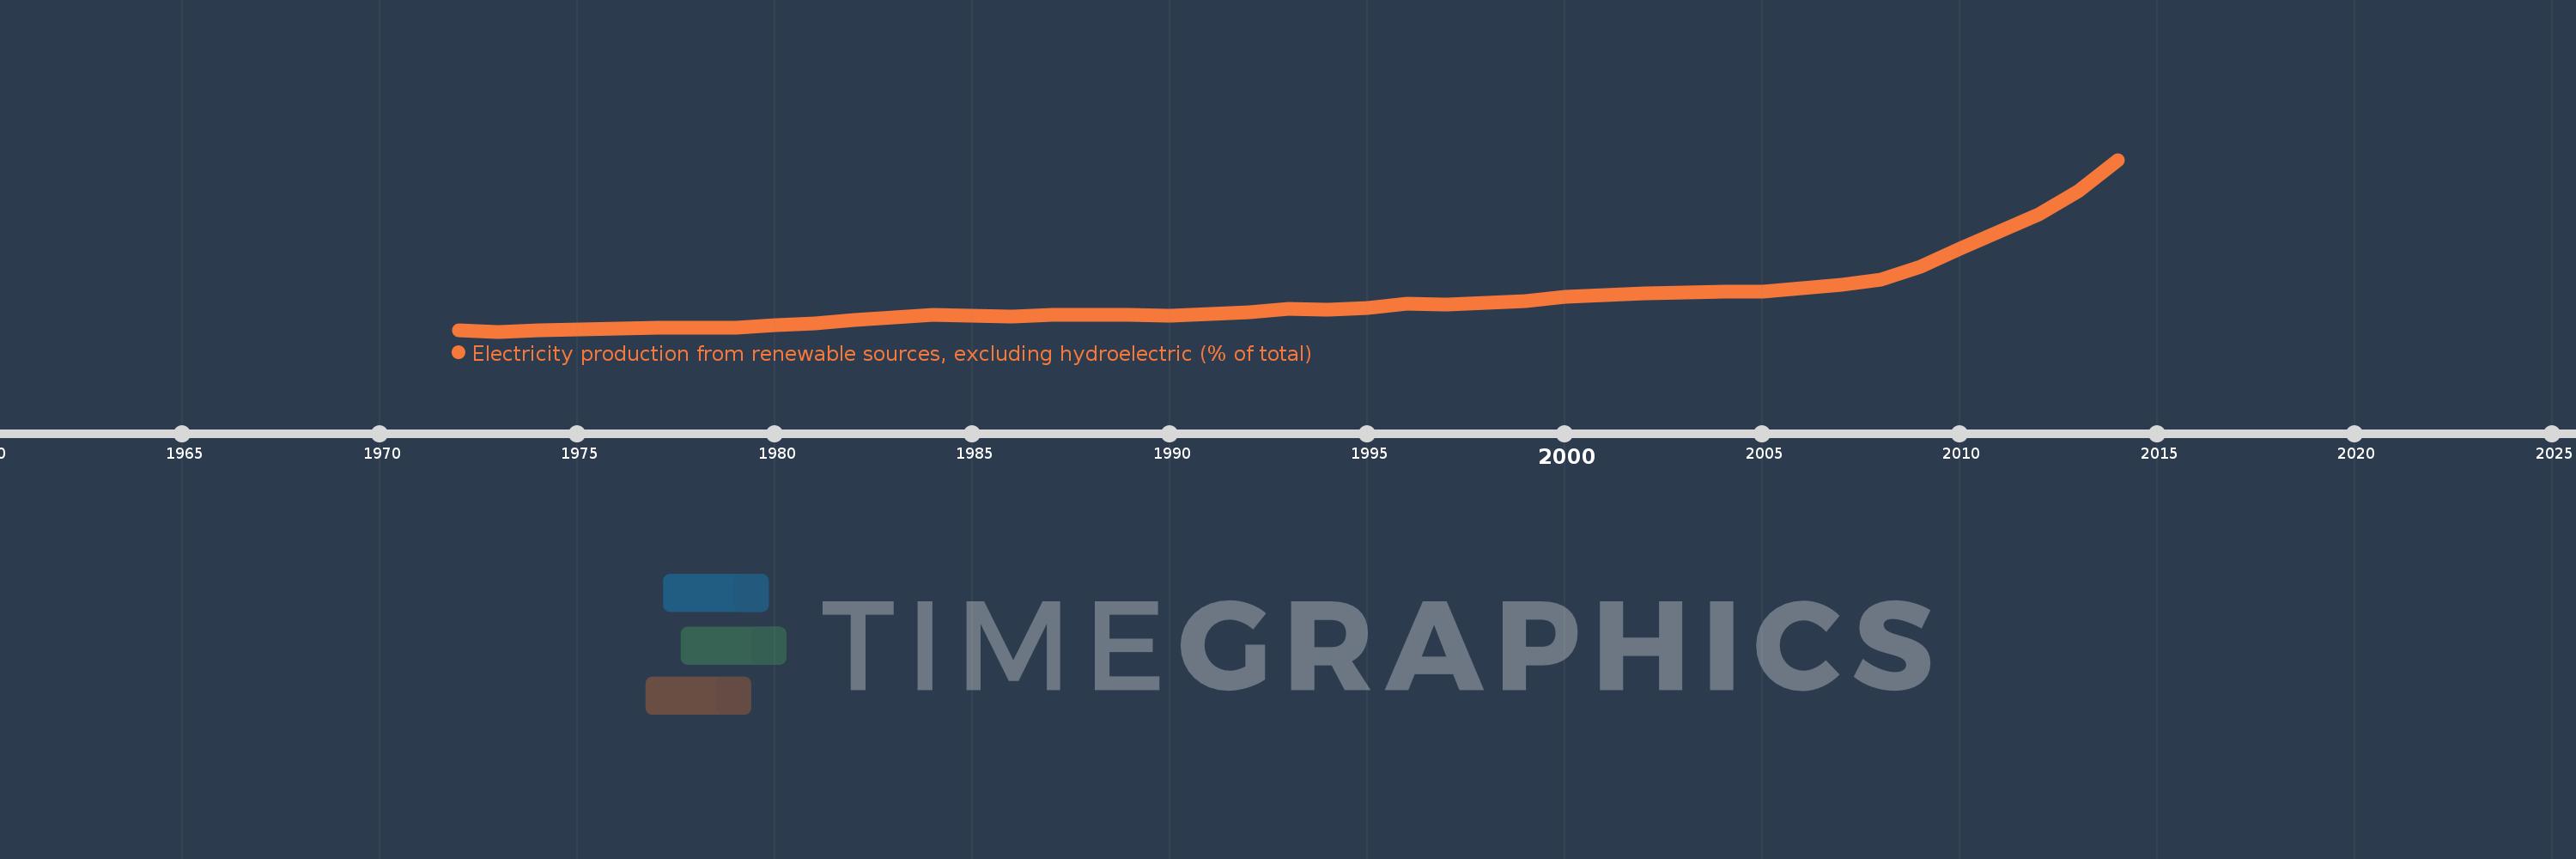
Electricity production from renewable sources, excluding hydroelectric (% of total)
2014,2013,2012,2011,2010,2009,2008,2007,2006,2005,2004,2003,2002,2001,2000,1999,1998,1997,1996,1995,1994,1993,1992,1991,1990,1989,1988,1987,1986,1985,1984,1983,1982,1981,1980,1979,1978,1977,1976,1975,1974,1973,1972
Estas estadísticas en otros países:
AlbaniaAlgeriaAngolaArab WorldArgentinaArmeniaAustraliaAustriaAzerbaijanBahrainBangladeshBelarusBelgiumBeninBoliviaBosnia and HerzegovinaBotswanaBrazilBrunei DarussalamBulgariaCambodiaCameroonCanadaCentral Europe and the BalticsChileChinaColombiaCongo, Dem. Rep.Congo, Rep.Costa RicaCote d'IvoireCroatiaCubaCuracaoCyprusCzech RepublicDenmarkDominican RepublicEarly-demographic dividendEast Asia & PacificEast Asia & Pacific (excluding high income)East Asia & Pacific (IDA & IBRD countries)EcuadorEgypt, Arab Rep.El SalvadorEritreaEstoniaEthiopiaEuro areaEurope & Central AsiaEurope & Central Asia (excluding high income)Europe & Central Asia (IDA & IBRD countries)European UnionFinlandFragile and conflict affected situationsFranceGabonGeorgiaGermanyGhanaGibraltarGreeceGuatemalaHaitiHeavily indebted poor countries (HIPC)High incomeHondurasHong Kong SAR, ChinaHungaryIBRD onlyIcelandIDA & IBRD totalIDA blendIDA onlyIDA totalIndiaIndonesiaIran, Islamic Rep.IraqIrelandIsraelItalyJamaicaJapanJordanKazakhstanKenyaKorea, Dem. People’s Rep.Korea, Rep.KosovoKuwaitKyrgyz RepublicLate-demographic dividendLatin America & Caribbean Latin America & Caribbean (excluding high income)Latin America & the Caribbean (IDA & IBRD countries)LatviaLeast developed countries: UN classificationLebanonLibyaLithuaniaLow & middle incomeLower middle incomeLuxembourgMacedonia, FYRMalaysiaMaltaMauritiusMexicoMiddle East & North AfricaMiddle East & North Africa (excluding high income)Middle East & North Africa (IDA & IBRD countries)Middle incomeMoldovaMongoliaMontenegroMoroccoMozambiqueMyanmarNamibiaNepalNetherlandsNew ZealandNicaraguaNigerNigeriaNorth AmericaNorwayOECD membersOmanOther small statesPakistanPanamaParaguayPeruPhilippinesPolandPortugalPost-demographic dividendPre-demographic dividendQatarRomaniaRussian FederationSaudi ArabiaSenegalSerbiaSingaporeSlovak RepublicSloveniaSmall statesSouth AfricaSouth AsiaSouth Asia (IDA & IBRD)South SudanSpainSri LankaSub-Saharan Africa Sub-Saharan Africa (excluding high income)Sub-Saharan Africa (IDA & IBRD countries)SudanSwedenSwitzerlandSyrian Arab RepublicTajikistanTanzaniaThailandTogoTrinidad and TobagoTunisiaTurkeyTurkmenistanUkraineUnited Arab EmiratesUnited KingdomUnited StatesUpper middle incomeUruguayUzbekistanVenezuela, RBVietnamWorldYemen, Rep.ZambiaZimbabwe línea de tiempo (timeline):
En esta escala de tiempo se presenta un gráfico de 1972 y 2014 de Middle income. Los datos de 1971 están ausentes. El número de observaciones reales por fecha: 43.
Fuente (nombre):
Indicadores del desarrollo mundial
Fuente (organización):
IEA Statistics © OECD/IEA 2014 (http://www.iea.org/stats/index.asp), subject to https://www.iea.org/t&c/termsandconditions/
Categorías:
Energy & Mining, Climate Change, Environment
Se ha actualizado:
23 abr 2017 año
Los indicadores de los cambios de valor en los últimos años
Mínimo:
0.208
1 ene 1973 año
Máximo:
3.201
1 ene 2014 año
A la fecha de observación
Valor
Cambio absoluto
El cambio con respecto al valor anterior
1 ene 1972 año
0.23
+0.23
0.0%
1 ene 1973 año
0.208
-0.022
-9.62%
1 ene 1974 año
0.223
+0.014
6.89%
1 ene 1975 año
0.242
+0.02
8.88%
1 ene 1976 año
0.258
+0.015
6.3%
1 ene 1977 año
0.271
+0.013
5.04%
1 ene 1978 año
0.274
+0.003
1.23%
1 ene 1979 año
0.268
-0.006
-2.08%
1 ene 1980 año
0.315
+0.047
17.5%
1 ene 1981 año
0.356
+0.04
12.82%
1 ene 1982 año
0.404
+0.048
13.58%
1 ene 1983 año
0.451
+0.048
11.8%
1 ene 1984 año
0.504
+0.053
11.73%
1 ene 1985 año
0.479
-0.026
-5.11%
1 ene 1986 año
0.473
-0.005
-1.11%
1 ene 1987 año
0.5
+0.027
5.73%
1 ene 1988 año
0.506
+0.005
1.05%
1 ene 1989 año
0.493
-0.012
-2.41%
1 ene 1990 año
0.487
-0.006
-1.31%
1 ene 1991 año
0.51
+0.023
4.67%
1 ene 1992 año
0.538
+0.029
5.59%
1 ene 1993 año
0.599
+0.06
11.21%
1 ene 1994 año
0.584
-0.015
-2.51%
1 ene 1995 año
0.621
+0.038
6.43%
1 ene 1996 año
0.692
+0.071
11.4%
1 ene 1997 año
0.684
-0.008
-1.18%
1 ene 1998 año
0.714
+0.03
4.35%
1 ene 1999 año
0.739
+0.026
3.64%
1 ene 2000 año
0.809
+0.069
9.34%
1 ene 2001 año
0.85
+0.042
5.16%
1 ene 2002 año
0.879
+0.028
3.35%
1 ene 2003 año
0.884
+0.005
0.55%
1 ene 2004 año
0.905
+0.022
2.43%
1 ene 2005 año
0.911
+0.006
0.67%
1 ene 2006 año
0.968
+0.056
6.18%
1 ene 2007 año
1.02
+0.052
5.4%
1 ene 2008 año
1.117
+0.097
9.55%
1 ene 2009 año
1.335
+0.218
19.52%
1 ene 2010 año
1.65
+0.314
23.55%
1 ene 2011 año
1.944
+0.295
17.86%
1 ene 2012 año
2.258
+0.314
16.15%
1 ene 2013 año
2.651
+0.393
17.4%
1 ene 2014 año
3.201
+0.549
20.72%
Ranking de los países por los datos estadísticos actuales


Comentarios: