29
/es/
es
AIzaSyAYiBZKx7MnpbEhh9jyipgxe19OcubqV5w
April 1, 2024
53060
OECD members
OED
false
2
1
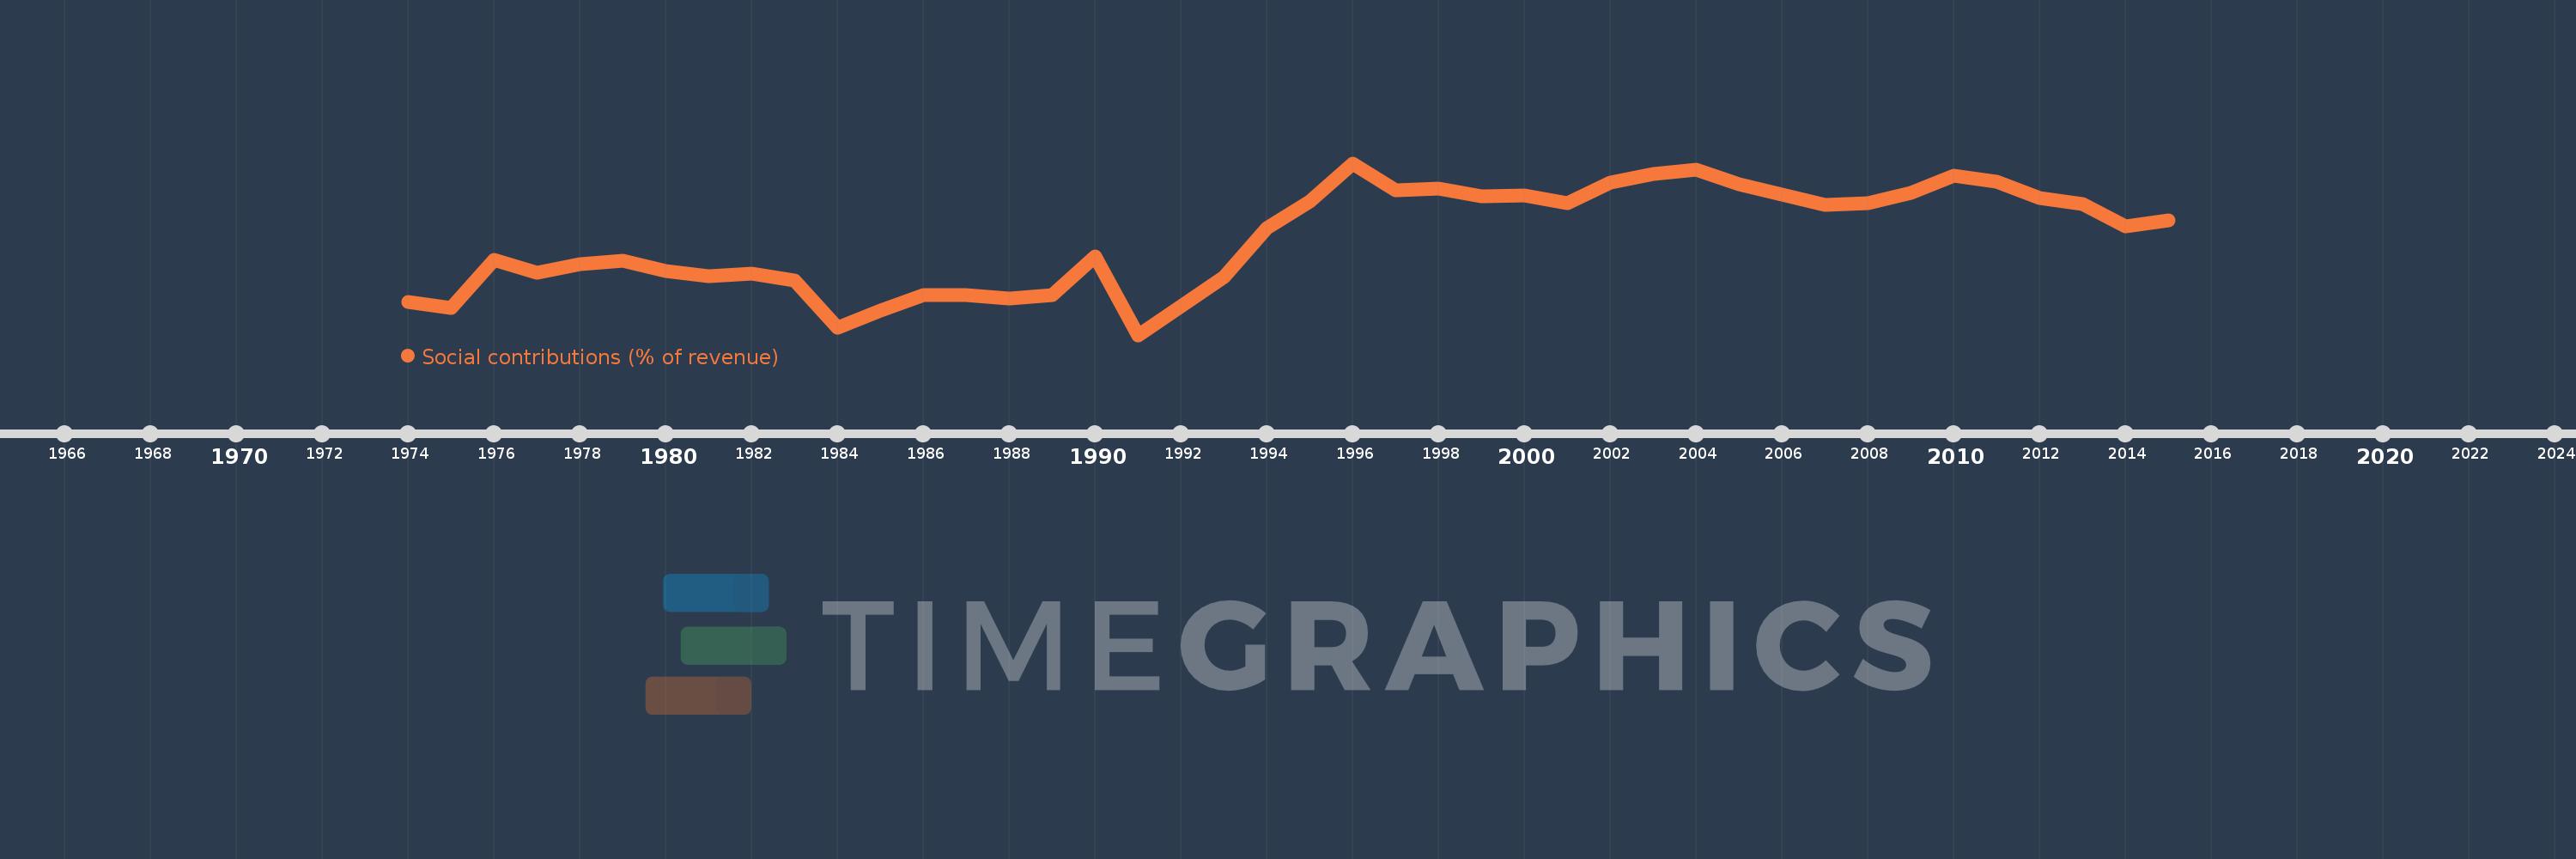
Social contributions (% of revenue)
2015,2014,2013,2012,2011,2010,2009,2008,2007,2006,2005,2004,2003,2002,2001,2000,1999,1998,1997,1996,1995,1994,1993,1992,1991,1990,1989,1988,1987,1986,1985,1984,1983,1982,1981,1980,1979,1978,1977,1976,1975,1974
Estas estadísticas en otros países:
línea de tiempo (timeline):
En esta escala de tiempo se presenta un gráfico de 1974 y 2015 de OECD members. Los datos de 1973 están ausentes. El número de observaciones reales por fecha: 42.
Fuente (nombre):
Indicadores del desarrollo mundial
Fuente (organización):
International Monetary Fund, Government Finance Statistics Yearbook and data files.
Categorías:
Public Sector
Se ha actualizado:
23 abr 2017 año
Los indicadores de los cambios de valor en los últimos años
Mínimo:
21.797
1 ene 1991 año
Máximo:
33.506
1 ene 1996 año
A la fecha de observación
Valor
Cambio absoluto
El cambio con respecto al valor anterior
1 ene 1974 año
24.037
+24.037
0.0%
1 ene 1975 año
23.639
-0.399
-1.66%
1 ene 1976 año
26.939
+3.3
13.96%
1 ene 1977 año
26.059
-0.88
-3.27%
1 ene 1978 año
26.652
+0.593
2.28%
1 ene 1979 año
26.858
+0.206
0.77%
1 ene 1980 año
26.159
-0.699
-2.6%
1 ene 1981 año
25.789
-0.37
-1.42%
1 ene 1982 año
26.01
+0.221
0.86%
1 ene 1983 año
25.534
-0.476
-1.83%
1 ene 1984 año
22.311
-3.223
-12.62%
1 ene 1985 año
23.442
+1.131
5.07%
1 ene 1986 año
24.495
+1.053
4.49%
1 ene 1987 año
24.545
+0.049
0.2%
1 ene 1988 año
24.309
-0.236
-0.96%
1 ene 1989 año
24.497
+0.188
0.77%
1 ene 1990 año
27.148
+2.651
10.82%
1 ene 1991 año
21.797
-5.351
-19.71%
1 ene 1992 año
23.754
+1.957
8.98%
1 ene 1993 año
25.75
+1.996
8.4%
1 ene 1994 año
29.089
+3.339
12.97%
1 ene 1995 año
30.874
+1.785
6.14%
1 ene 1996 año
33.506
+2.632
8.53%
1 ene 1997 año
31.681
-1.825
-5.45%
1 ene 1998 año
31.795
+0.114
0.36%
1 ene 1999 año
31.231
-0.564
-1.77%
1 ene 2000 año
31.325
+0.094
0.3%
1 ene 2001 año
30.791
-0.534
-1.71%
1 ene 2002 año
32.175
+1.383
4.49%
1 ene 2003 año
32.795
+0.621
1.93%
1 ene 2004 año
33.074
+0.279
0.85%
1 ene 2005 año
32.088
-0.987
-2.98%
1 ene 2006 año
31.353
-0.735
-2.29%
1 ene 2007 año
30.692
-0.661
-2.11%
1 ene 2008 año
30.785
+0.093
0.3%
1 ene 2009 año
31.481
+0.696
2.26%
1 ene 2010 año
32.669
+1.188
3.77%
1 ene 2011 año
32.264
-0.405
-1.24%
1 ene 2012 año
31.143
-1.121
-3.48%
1 ene 2013 año
30.735
-0.408
-1.31%
1 ene 2014 año
29.223
-1.512
-4.92%
1 ene 2015 año
29.627
+0.404
1.38%
Ranking de los países por los datos estadísticos actuales


Comentarios: