29
/es/
es
AIzaSyAYiBZKx7MnpbEhh9jyipgxe19OcubqV5w
April 1, 2024
36201
High income
HIC
false
2
1
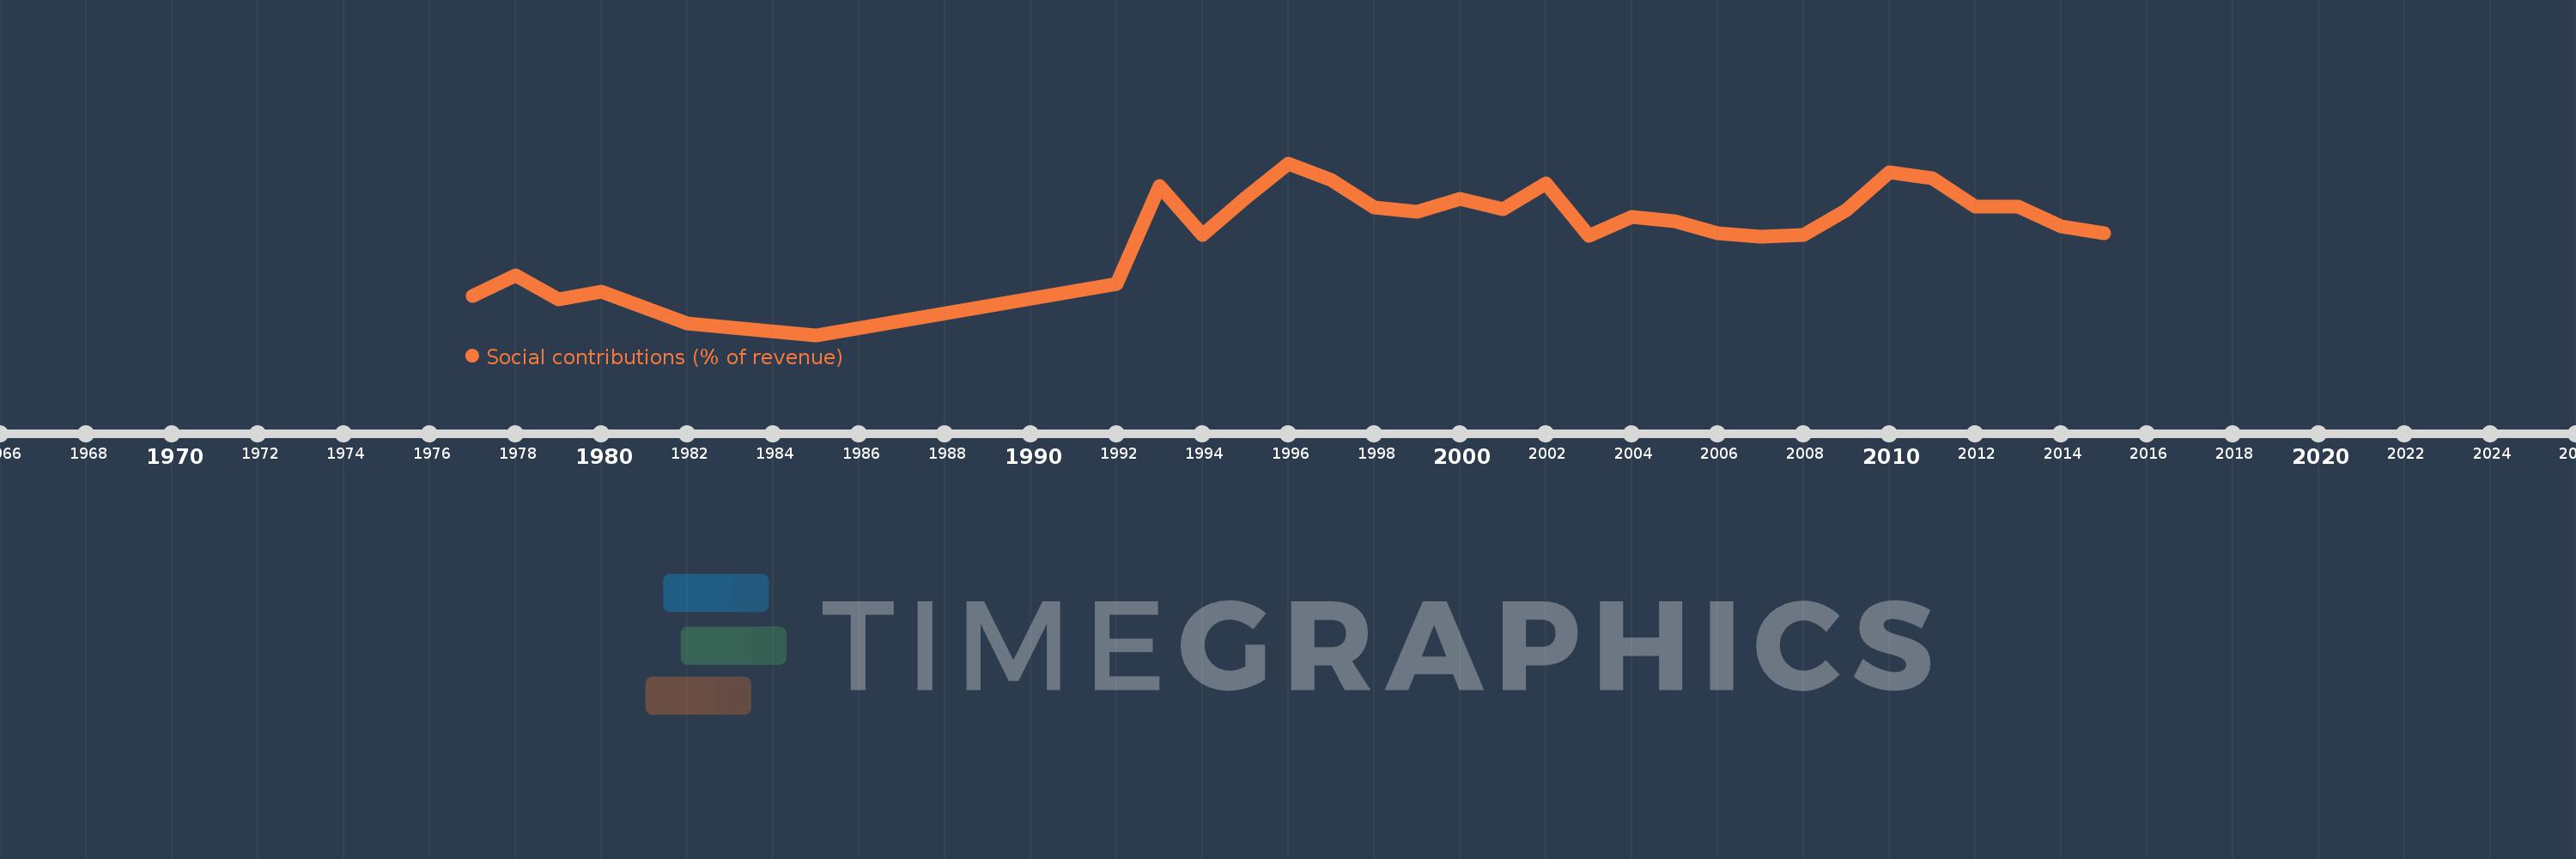
Social contributions (% of revenue)
2015,2014,2013,2012,2011,2010,2009,2008,2007,2006,2005,2004,2003,2002,2001,2000,1999,1998,1997,1996,1995,1994,1993,1992,1985,1982,1980,1979,1978,1977
Estas estadísticas en otros países:
línea de tiempo (timeline):
En esta escala de tiempo se presenta un gráfico de 1977 y 2015 de High income. Los datos de 1976 están ausentes. El número de observaciones reales por fecha: 30.
Fuente (nombre):
Indicadores del desarrollo mundial
Fuente (organización):
International Monetary Fund, Government Finance Statistics Yearbook and data files.
Categorías:
Public Sector
Se ha actualizado:
23 abr 2017 año
Los indicadores de los cambios de valor en los últimos años
Mínimo:
24.76
1 ene 1985 año
Máximo:
32.98
1 ene 1996 año
A la fecha de observación
Valor
Cambio absoluto
El cambio con respecto al valor anterior
1 ene 1977 año
26.611
+26.611
0.0%
1 ene 1978 año
27.609
+0.998
3.75%
1 ene 1979 año
26.481
-1.128
-4.09%
1 ene 1980 año
26.821
+0.339
1.28%
1 ene 1982 año
25.307
-1.514
-5.64%
1 ene 1985 año
24.76
-0.547
-2.16%
1 ene 1992 año
27.213
+2.453
9.91%
1 ene 1993 año
31.873
+4.66
17.12%
1 ene 1994 año
29.567
-2.306
-7.24%
1 ene 1995 año
31.322
+1.755
5.94%
1 ene 1996 año
32.98
+1.658
5.29%
1 ene 1997 año
32.181
-0.799
-2.42%
1 ene 1998 año
30.849
-1.332
-4.14%
1 ene 1999 año
30.647
-0.202
-0.65%
1 ene 2000 año
31.293
+0.646
2.11%
1 ene 2001 año
30.791
-0.501
-1.6%
1 ene 2002 año
32.013
+1.222
3.97%
1 ene 2003 año
29.518
-2.495
-7.79%
1 ene 2004 año
30.418
+0.901
3.05%
1 ene 2005 año
30.216
-0.203
-0.67%
1 ene 2006 año
29.647
-0.569
-1.88%
1 ene 2007 año
29.473
-0.174
-0.59%
1 ene 2008 año
29.556
+0.082
0.28%
1 ene 2009 año
30.741
+1.185
4.01%
1 ene 2010 año
32.54
+1.799
5.85%
1 ene 2011 año
32.264
-0.276
-0.85%
1 ene 2012 año
30.912
-1.352
-4.19%
1 ene 2013 año
30.884
-0.028
-0.09%
1 ene 2014 año
29.954
-0.929
-3.01%
1 ene 2015 año
29.634
-0.32
-1.07%
Ranking de los países por los datos estadísticos actuales


Comentarios: