30
/es/
AIzaSyAYiBZKx7MnpbEhh9jyipgxe19OcubqV5w
April 1, 2024
145116
Guatemala
GTM
true
2
1
Social contributions (% of revenue)
2014,2013,2012,2011,2010,2009,2008,2007,2006,2005,2004,2003,2002,2001,2000,1999,1998,1997,1996,1995,1994,1993,1992,1991
Download
Estadísticas Globales de la Biblioteca →Guatemala →

Social contributions (% of revenue)

Estas estadísticas en otros países:

AfghanistanAlbaniaAngolaArgentinaArmeniaAustraliaAustriaAzerbaijanBarbadosBelarusBelgiumBelizeBeninBhutanBoliviaBosnia and HerzegovinaBrazilBulgariaBurundiCabo VerdeCanadaCaribbean small statesCentral African RepublicCentral Europe and the BalticsChileChinaColombiaCongo, Rep.Costa RicaCote d'IvoireCroatiaCyprusCzech RepublicDenmarkDominican RepublicEgypt, Arab Rep.El SalvadorEstoniaEthiopiaEuro areaEurope & Central AsiaEurope & Central Asia (excluding high income)Europe & Central Asia (IDA & IBRD countries)European UnionFijiFinlandFranceGambia, TheGeorgiaGermanyGhanaGreeceGuatemalaHigh incomeHondurasHong Kong SAR, ChinaHungaryIBRD onlyIcelandIDA blendIndiaIndonesiaIran, Islamic Rep.IraqIrelandIsraelItalyJamaicaJapanJordanKazakhstanKenyaKorea, Rep.Late-demographic dividendLatin America & Caribbean Latin America & Caribbean (excluding high income)Latin America & the Caribbean (IDA & IBRD countries)LatviaLebanonLiberiaLithuaniaLuxembourgMacao SAR, ChinaMacedonia, FYRMadagascarMaltaMauritiusMexicoMoldovaMongoliaMoroccoMozambiqueNamibiaNetherlandsNew ZealandNorth AmericaNorwayOECD membersPanamaPapua New GuineaParaguayPeruPolandPortugalPost-demographic dividendRomaniaRussian FederationSan MarinoSao Tome and PrincipeSerbiaSeychellesSlovak RepublicSloveniaSmall statesSouth AfricaSouth AsiaSouth Asia (IDA & IBRD)SpainSri LankaSt. Kitts and NevisSwedenSwitzerlandSyrian Arab RepublicTajikistanThailandTrinidad and TobagoTunisiaTurkeyUkraineUnited Arab EmiratesUnited KingdomUnited StatesUpper middle incomeUruguayVenezuela, RBZambiaZimbabwe

línea de tiempo (timeline):

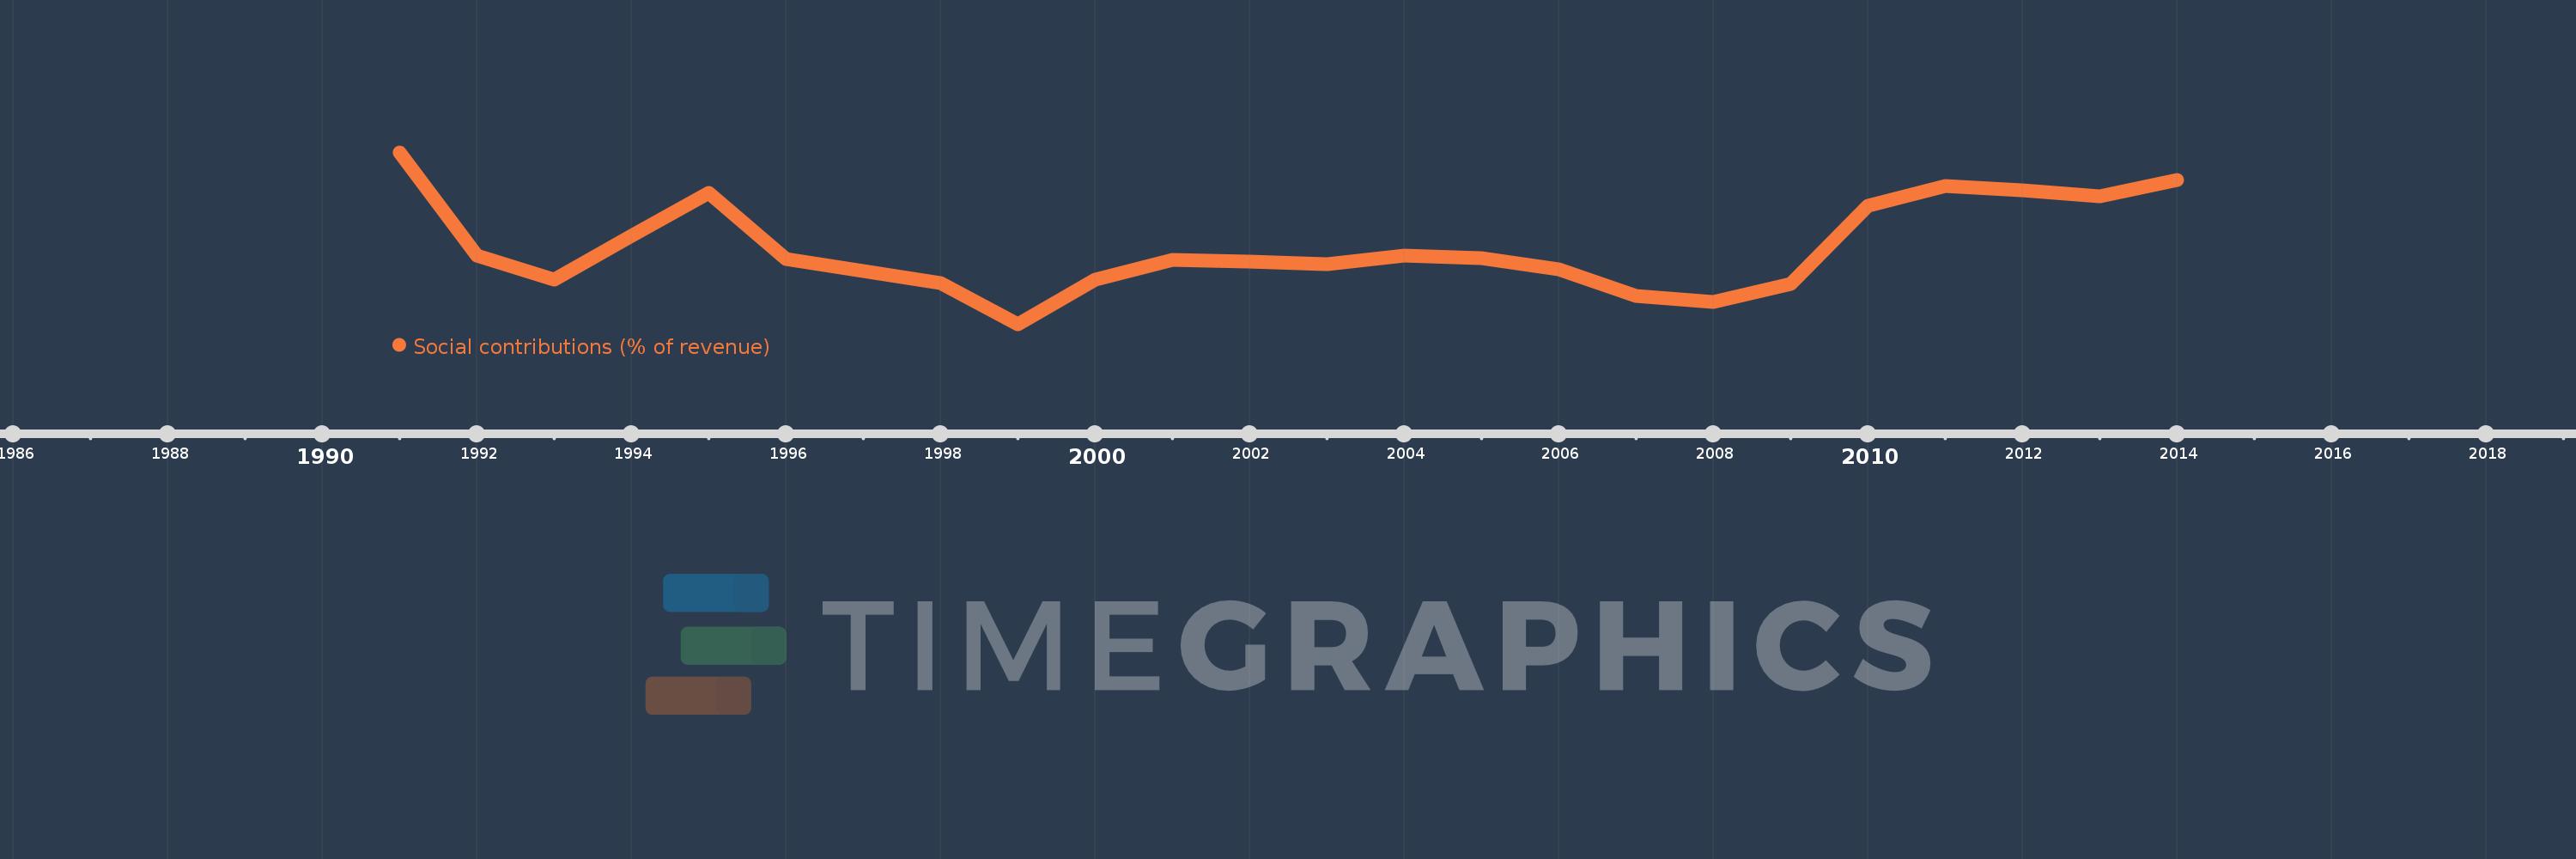
En esta escala de tiempo se presenta un gráfico de 1991 y 2014 de Guatemala. Los datos de 1990 están ausentes. El número de observaciones reales por fecha: 24.

Fuente (nombre):

Indicadores del desarrollo mundial

Fuente (organización):

International Monetary Fund, Government Finance Statistics Yearbook and data files.

Categorías:

Public Sector

Se ha actualizado:

23 abr 2017 año

Los indicadores de los cambios de valor en los últimos años

En promedio:
2.389
Mínimo:
1.79
1 ene 1999 año
Máximo:
3.131
1 ene 1991 año
A la fecha de observación
Valor
Cambio absoluto
El cambio con respecto al valor anterior
1 ene 1991 año
3.131
+3.131
0.0%
1 ene 1992 año
2.329
-0.803
-25.63%
1 ene 1993 año
2.141
-0.188
-8.06%
1 ene 1994 año
2.478
+0.337
15.74%
1 ene 1995 año
2.813
+0.335
13.53%
1 ene 1996 año
2.302
-0.511
-18.17%
1 ene 1997 año
2.206
-0.096
-4.16%
1 ene 1998 año
2.113
-0.093
-4.23%
1 ene 1999 año
1.79
-0.323
-15.29%
1 ene 2000 año
2.138
+0.348
19.46%
1 ene 2001 año
2.293
+0.155
7.26%
1 ene 2002 año
2.277
-0.016
-0.71%
1 ene 2003 año
2.262
-0.015
-0.65%
1 ene 2004 año
2.326
+0.064
2.83%
1 ene 2005 año
2.307
-0.019
-0.81%
1 ene 2006 año
2.22
-0.087
-3.78%
1 ene 2007 año
2.01
-0.21
-9.44%
1 ene 2008 año
1.965
-0.046
-2.28%
1 ene 2009 año
2.106
+0.141
7.19%
1 ene 2010 año
2.715
+0.609
28.91%
1 ene 2011 año
2.867
+0.152
5.6%
1 ene 2012 año
2.833
-0.034
-1.17%
1 ene 2013 año
2.788
-0.045
-1.59%
1 ene 2014 año
2.913
+0.125
4.49%

Ranking de los países por los datos estadísticos actuales