29
/es/
es
AIzaSyAYiBZKx7MnpbEhh9jyipgxe19OcubqV5w
April 1, 2024
198295
Moldova
MDA
true
2
1
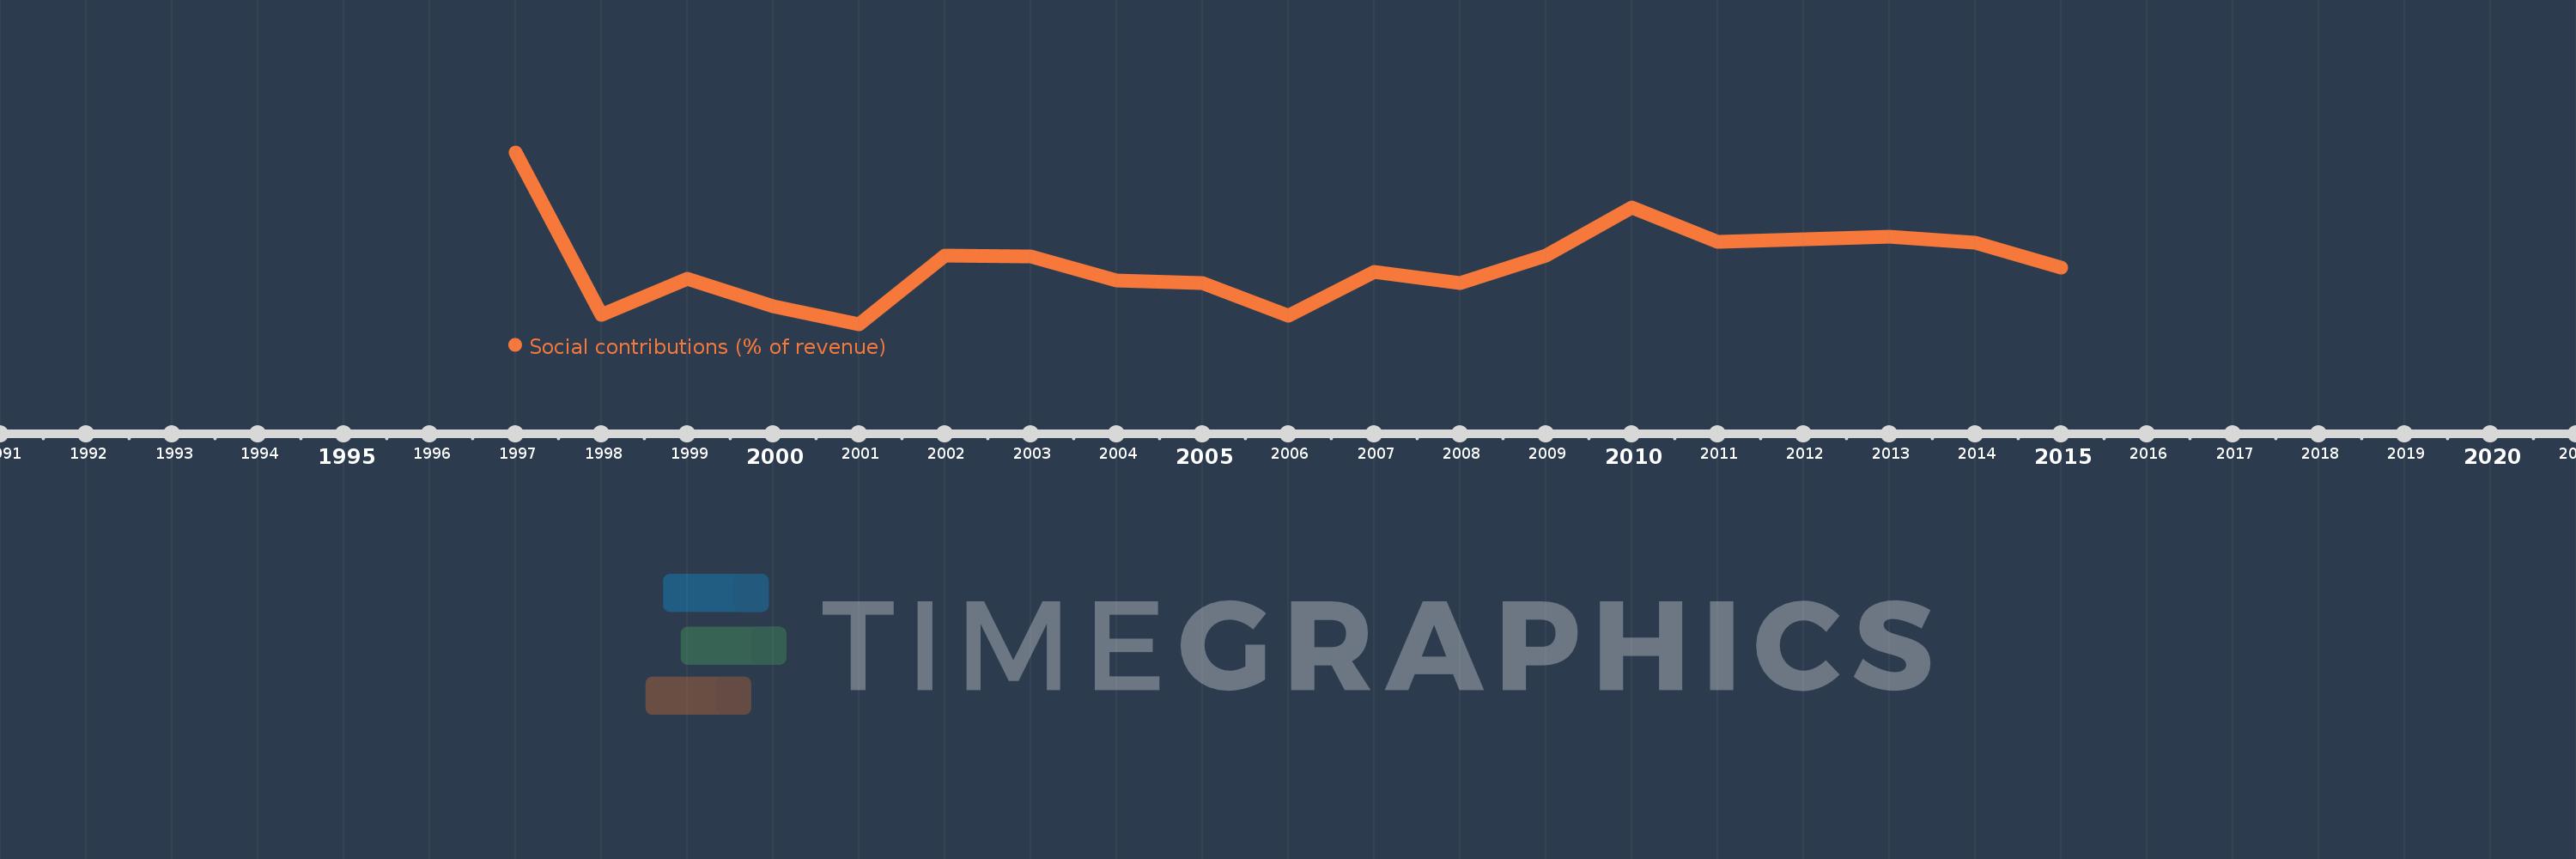
Social contributions (% of revenue)
2015,2014,2013,2012,2011,2010,2009,2008,2007,2006,2005,2004,2003,2002,2001,2000,1999,1998,1997
Estas estadísticas en otros países:
línea de tiempo (timeline):
En esta escala de tiempo se presenta un gráfico de 1997 y 2015 de Moldova. Los datos de 1996 están ausentes. El número de observaciones reales por fecha: 19.
Fuente (nombre):
Indicadores del desarrollo mundial
Fuente (organización):
International Monetary Fund, Government Finance Statistics Yearbook and data files.
Categorías:
Public Sector
Se ha actualizado:
23 abr 2017 año
Los indicadores de los cambios de valor en los últimos años
Mínimo:
22.886
1 ene 2001 año
Máximo:
38.368
1 ene 1997 año
A la fecha de observación
Valor
Cambio absoluto
El cambio con respecto al valor anterior
1 ene 1997 año
38.368
+38.368
0.0%
1 ene 1998 año
23.693
-14.674
-38.25%
1 ene 1999 año
26.949
+3.256
13.74%
1 ene 2000 año
24.499
-2.45
-9.09%
1 ene 2001 año
22.886
-1.613
-6.59%
1 ene 2002 año
29.05
+6.164
26.93%
1 ene 2003 año
29.028
-0.022
-0.08%
1 ene 2004 año
26.817
-2.212
-7.62%
1 ene 2005 año
26.596
-0.22
-0.82%
1 ene 2006 año
23.691
-2.905
-10.92%
1 ene 2007 año
27.628
+3.936
16.61%
1 ene 2008 año
26.557
-1.07
-3.87%
1 ene 2009 año
29.096
+2.538
9.56%
1 ene 2010 año
33.409
+4.313
14.82%
1 ene 2011 año
30.306
-3.103
-9.29%
1 ene 2012 año
30.527
+0.222
0.73%
1 ene 2013 año
30.791
+0.264
0.86%
1 ene 2014 año
30.199
-0.592
-1.92%
1 ene 2015 año
27.996
-2.203
-7.3%
Ranking de los países por los datos estadísticos actuales


Comentarios: