29
/es/
es
AIzaSyAYiBZKx7MnpbEhh9jyipgxe19OcubqV5w
April 1, 2024
276183
United Kingdom
GBR
true
2
1
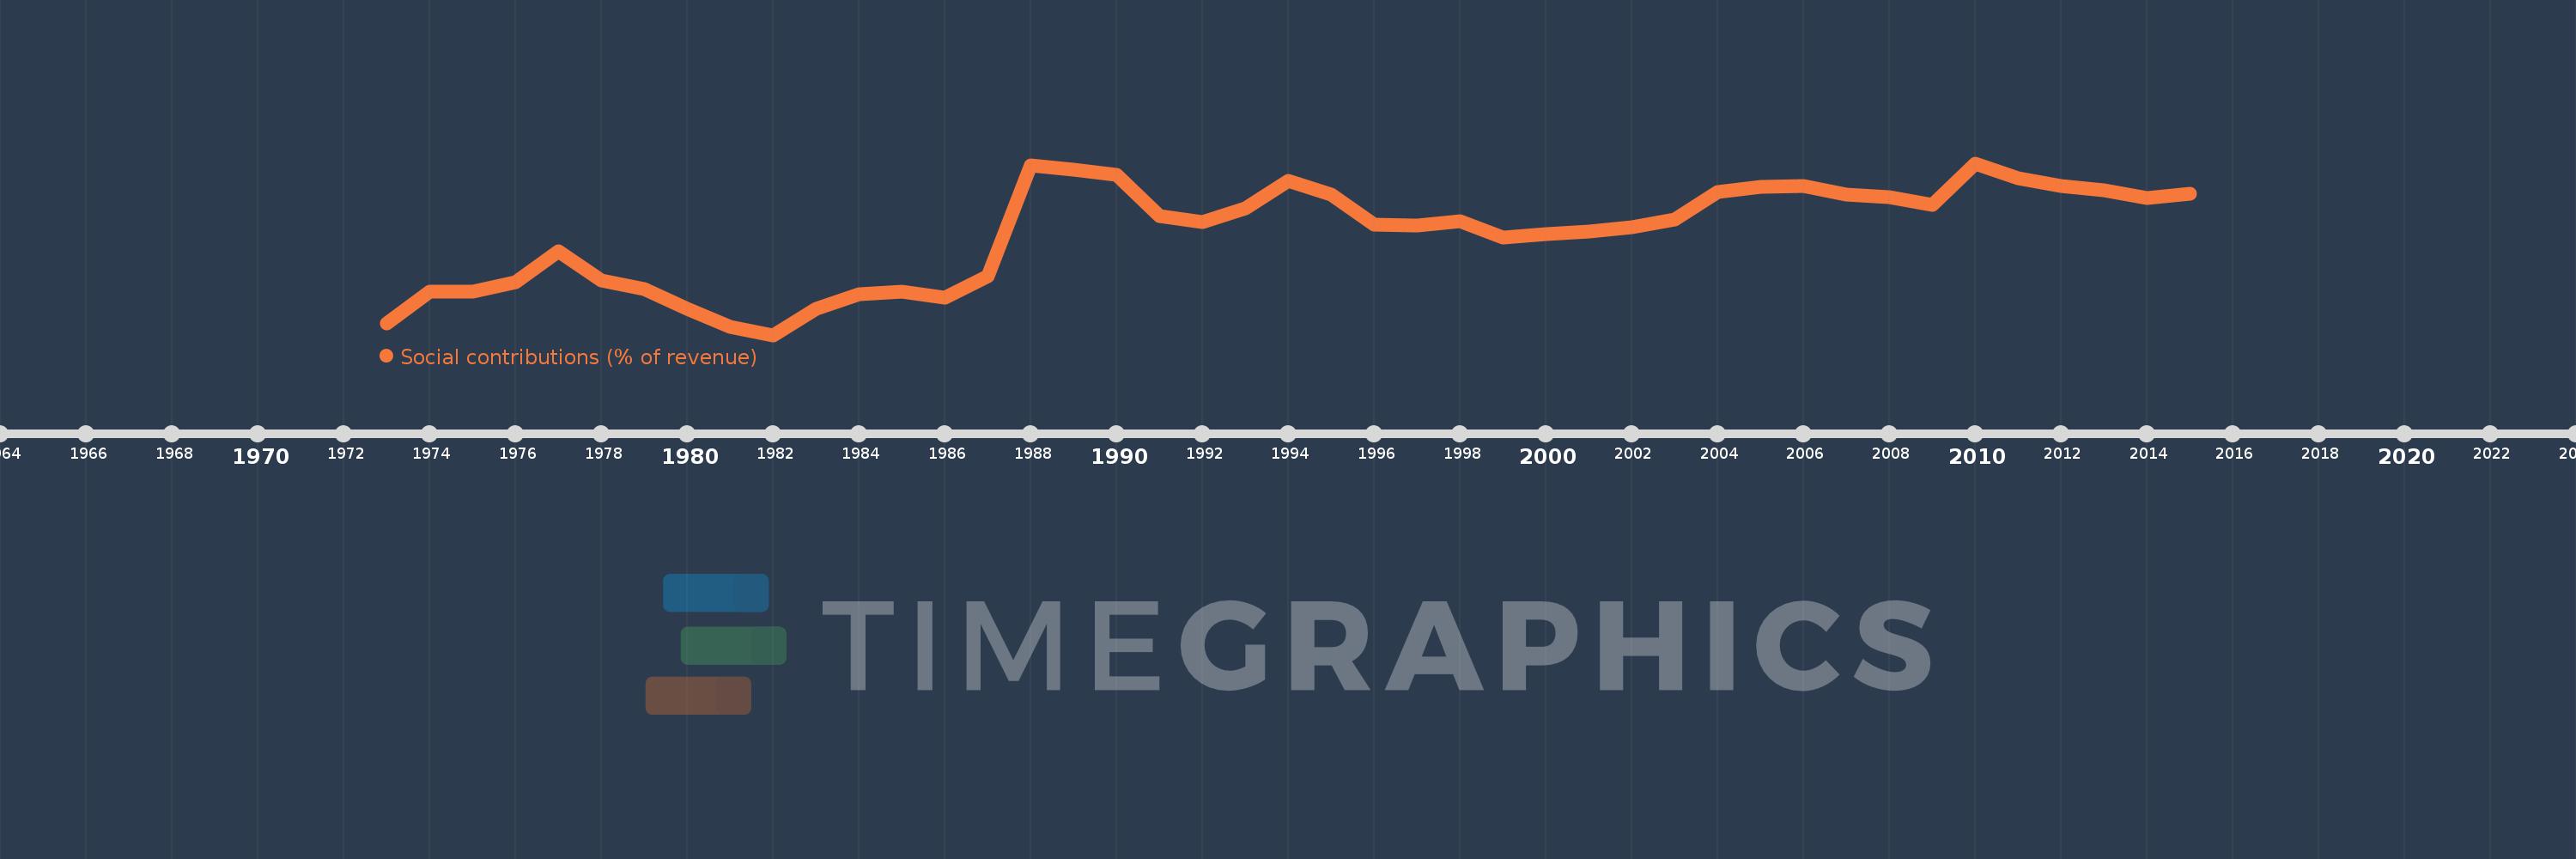
Social contributions (% of revenue)
2015,2014,2013,2012,2011,2010,2009,2008,2007,2006,2005,2004,2003,2002,2001,2000,1999,1998,1997,1996,1995,1994,1993,1992,1991,1990,1989,1988,1987,1986,1985,1984,1983,1982,1981,1980,1979,1978,1977,1976,1975,1974,1973
Estas estadísticas en otros países:
línea de tiempo (timeline):
En esta escala de tiempo se presenta un gráfico de 1973 y 2015 de United Kingdom. Los datos de 1972 están ausentes. El número de observaciones reales por fecha: 43.
Fuente (nombre):
Indicadores del desarrollo mundial
Fuente (organización):
International Monetary Fund, Government Finance Statistics Yearbook and data files.
Categorías:
Public Sector
Se ha actualizado:
23 abr 2017 año
Los indicadores de los cambios de valor en los últimos años
Mínimo:
15.164
1 ene 1982 año
Máximo:
22.259
1 ene 2010 año
A la fecha de observación
Valor
Cambio absoluto
El cambio con respecto al valor anterior
1 ene 1973 año
15.626
+15.626
0.0%
1 ene 1974 año
16.969
+1.343
8.59%
1 ene 1975 año
16.952
-0.017
-0.1%
1 ene 1976 año
17.342
+0.389
2.3%
1 ene 1977 año
18.609
+1.267
7.31%
1 ene 1978 año
17.421
-1.188
-6.39%
1 ene 1979 año
17.051
-0.37
-2.12%
1 ene 1980 año
16.245
-0.805
-4.72%
1 ene 1981 año
15.485
-0.761
-4.68%
1 ene 1982 año
15.164
-0.321
-2.07%
1 ene 1983 año
16.257
+1.093
7.21%
1 ene 1984 año
16.846
+0.589
3.62%
1 ene 1985 año
16.939
+0.092
0.55%
1 ene 1986 año
16.707
-0.232
-1.37%
1 ene 1987 año
17.59
+0.883
5.29%
1 ene 1988 año
22.172
+4.582
26.05%
1 ene 1989 año
21.977
-0.195
-0.88%
1 ene 1990 año
21.796
-0.18
-0.82%
1 ene 1991 año
20.09
-1.706
-7.83%
1 ene 1992 año
19.841
-0.249
-1.24%
1 ene 1993 año
20.381
+0.54
2.72%
1 ene 1994 año
21.521
+1.14
5.59%
1 ene 1995 año
20.97
-0.551
-2.56%
1 ene 1996 año
19.712
-1.258
-6.0%
1 ene 1997 año
19.682
-0.031
-0.16%
1 ene 1998 año
19.861
+0.18
0.91%
1 ene 1999 año
19.182
-0.679
-3.42%
1 ene 2000 año
19.337
+0.155
0.81%
1 ene 2001 año
19.435
+0.098
0.51%
1 ene 2002 año
19.6
+0.165
0.85%
1 ene 2003 año
19.92
+0.32
1.63%
1 ene 2004 año
21.053
+1.134
5.69%
1 ene 2005 año
21.285
+0.231
1.1%
1 ene 2006 año
21.33
+0.046
0.21%
1 ene 2007 año
20.958
-0.373
-1.75%
1 ene 2008 año
20.856
-0.102
-0.48%
1 ene 2009 año
20.553
-0.303
-1.45%
1 ene 2010 año
22.259
+1.706
8.3%
1 ene 2011 año
21.64
-0.619
-2.78%
1 ene 2012 año
21.332
-0.308
-1.42%
1 ene 2013 año
21.158
-0.174
-0.82%
1 ene 2014 año
20.825
-0.334
-1.58%
1 ene 2015 año
21.014
+0.189
0.91%
Ranking de los países por los datos estadísticos actuales


Comentarios: