29
/es/
es
AIzaSyAYiBZKx7MnpbEhh9jyipgxe19OcubqV5w
April 1, 2024
52694
OECD members
OED
false
2
1
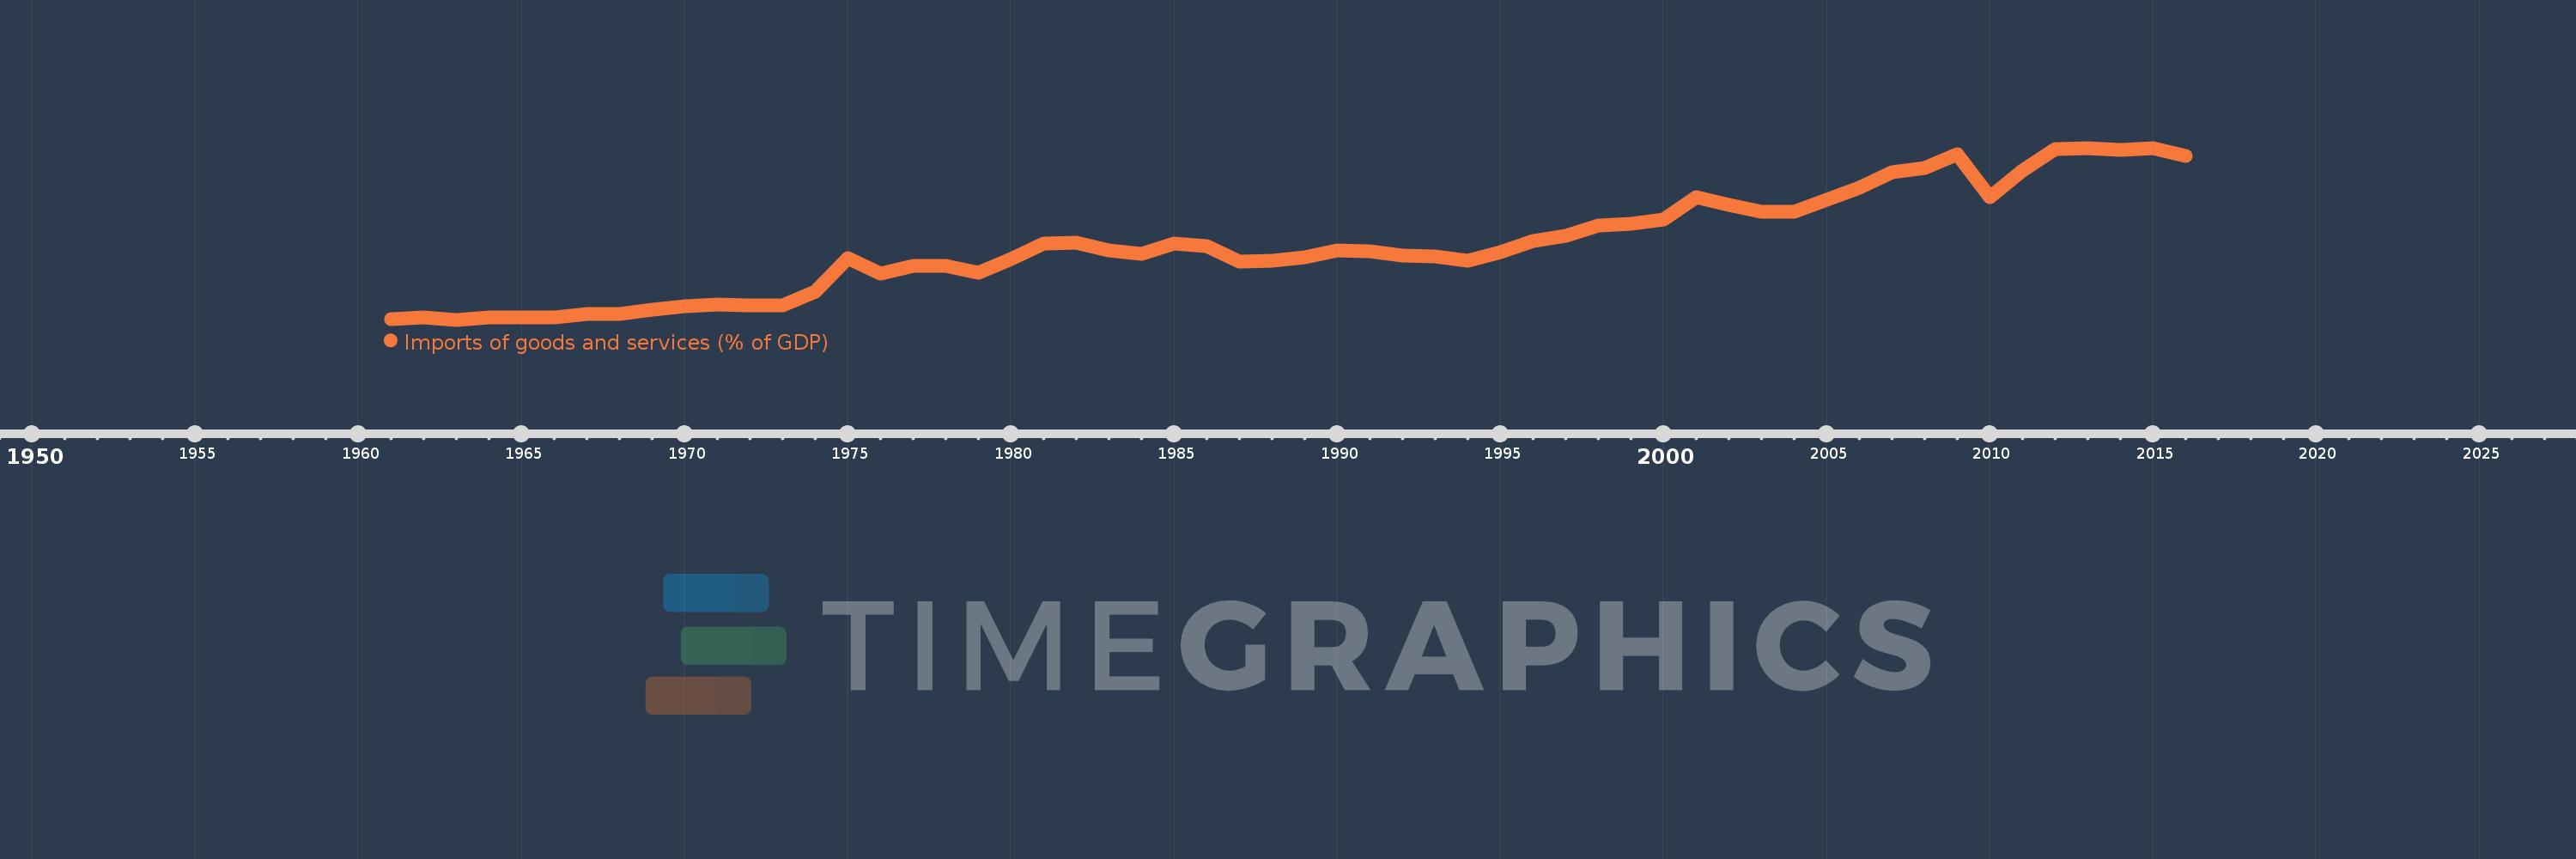
Imports of goods and services (% of GDP)
2016,2015,2014,2013,2012,2011,2010,2009,2008,2007,2006,2005,2004,2003,2002,2001,2000,1999,1998,1997,1996,1995,1994,1993,1992,1991,1990,1989,1988,1987,1986,1985,1984,1983,1982,1981,1980,1979,1978,1977,1976,1975,1974,1973,1972,1971,1970,1969,1968,1967,1966,1965,1964,1963,1962,1961
Estas estadísticas en otros países:
AfghanistanAlbaniaAlgeriaAngolaAntigua and BarbudaArab WorldArgentinaArmeniaArubaAustraliaAustriaAzerbaijanBahamas, TheBahrainBangladeshBarbadosBelarusBelgiumBelizeBeninBermudaBhutanBoliviaBosnia and HerzegovinaBotswanaBrazilBrunei DarussalamBulgariaBurkina FasoBurundiCabo VerdeCambodiaCameroonCanadaCaribbean small statesCentral African RepublicCentral Europe and the BalticsChadChileChinaColombiaComorosCongo, Dem. Rep.Congo, Rep.Costa RicaCote d'IvoireCroatiaCubaCyprusCzech RepublicDenmarkDjiboutiDominicaDominican RepublicEarly-demographic dividendEast Asia & PacificEast Asia & Pacific (excluding high income)East Asia & Pacific (IDA & IBRD countries)EcuadorEgypt, Arab Rep.El SalvadorEquatorial GuineaEritreaEstoniaEthiopiaEuro areaEurope & Central AsiaEurope & Central Asia (excluding high income)Europe & Central Asia (IDA & IBRD countries)European UnionFaroe IslandsFijiFinlandFragile and conflict affected situationsFranceFrench PolynesiaGabonGambia, TheGeorgiaGermanyGhanaGreeceGrenadaGuatemalaGuineaGuinea-BissauGuyanaHaitiHeavily indebted poor countries (HIPC)High incomeHondurasHong Kong SAR, ChinaHungaryIBRD onlyIcelandIDA & IBRD totalIDA blendIDA onlyIDA totalIndiaIndonesiaIran, Islamic Rep.IraqIrelandIsraelItalyJamaicaJapanJordanKazakhstanKenyaKiribatiKorea, Rep.KosovoKuwaitKyrgyz RepublicLao PDRLate-demographic dividendLatin America & Caribbean Latin America & Caribbean (excluding high income)Latin America & the Caribbean (IDA & IBRD countries)LatviaLeast developed countries: UN classificationLebanonLesothoLiberiaLibyaLithuaniaLow & middle incomeLow incomeLower middle incomeLuxembourgMacao SAR, ChinaMacedonia, FYRMadagascarMalawiMalaysiaMaldivesMaliMaltaMauritaniaMauritiusMexicoMicronesia, Fed. Sts.Middle East & North AfricaMiddle East & North Africa (excluding high income)Middle East & North Africa (IDA & IBRD countries)Middle incomeMoldovaMongoliaMontenegroMoroccoMozambiqueMyanmarNamibiaNepalNetherlandsNew CaledoniaNew ZealandNicaraguaNigerNigeriaNorth AmericaNorwayOECD membersOmanOther small statesPacific island small statesPakistanPalauPanamaPapua New GuineaParaguayPeruPhilippinesPolandPortugalPost-demographic dividendPre-demographic dividendPuerto RicoQatarRomaniaRussian FederationRwandaSamoaSaudi ArabiaSenegalSerbiaSeychellesSierra LeoneSingaporeSlovak RepublicSloveniaSmall statesSolomon IslandsSomaliaSouth AfricaSouth AsiaSouth Asia (IDA & IBRD)South SudanSpainSri LankaSt. Kitts and NevisSt. LuciaSt. Vincent and the GrenadinesSub-Saharan Africa Sub-Saharan Africa (excluding high income)Sub-Saharan Africa (IDA & IBRD countries)SudanSurinameSwazilandSwedenSwitzerlandSyrian Arab RepublicTajikistanTanzaniaThailandTimor-LesteTogoTongaTrinidad and TobagoTunisiaTurkeyTurkmenistanUgandaUkraineUnited Arab EmiratesUnited KingdomUnited StatesUpper middle incomeUruguayUzbekistanVanuatuVenezuela, RBVietnamWest Bank and GazaWorldYemen, Rep.ZambiaZimbabwe línea de tiempo (timeline):
En esta escala de tiempo se presenta un gráfico de 1961 y 2016 de OECD members. Los datos de 1960 están ausentes. El número de observaciones reales por fecha: 56.
Fuente (nombre):
Indicadores del desarrollo mundial
Fuente (organización):
World Bank national accounts data, and OECD National Accounts data files.
Categorías:
Economy & Growth, Trade
Se ha actualizado:
23 abr 2017 año
Los indicadores de los cambios de valor en los últimos años
Mínimo:
11.774
1 ene 1963 año
Máximo:
28.913
1 ene 2013 año
A la fecha de observación
Valor
Cambio absoluto
El cambio con respecto al valor anterior
1 ene 1961 año
11.876
+11.876
0.0%
1 ene 1962 año
11.979
+0.103
0.86%
1 ene 1963 año
11.774
-0.205
-1.71%
1 ene 1964 año
11.981
+0.208
1.76%
1 ene 1965 año
11.984
+0.002
0.02%
1 ene 1966 año
12.024
+0.04
0.33%
1 ene 1967 año
12.319
+0.296
2.46%
1 ene 1968 año
12.322
+0.003
0.02%
1 ene 1969 año
12.785
+0.463
3.76%
1 ene 1970 año
13.118
+0.333
2.6%
1 ene 1971 año
13.28
+0.163
1.24%
1 ene 1972 año
13.198
-0.082
-0.62%
1 ene 1973 año
13.2
+0.001
0.01%
1 ene 1974 año
14.58
+1.381
10.46%
1 ene 1975 año
17.918
+3.338
22.89%
1 ene 1976 año
16.334
-1.584
-8.84%
1 ene 1977 año
17.112
+0.777
4.76%
1 ene 1978 año
17.12
+0.008
0.05%
1 ene 1979 año
16.479
-0.64
-3.74%
1 ene 1980 año
17.853
+1.373
8.33%
1 ene 1981 año
19.412
+1.56
8.74%
1 ene 1982 año
19.418
+0.006
0.03%
1 ene 1983 año
18.728
-0.69
-3.56%
1 ene 1984 año
18.314
-0.414
-2.21%
1 ene 1985 año
19.379
+1.065
5.82%
1 ene 1986 año
19.16
-0.219
-1.13%
1 ene 1987 año
17.537
-1.623
-8.47%
1 ene 1988 año
17.684
+0.147
0.84%
1 ene 1989 año
18.002
+0.318
1.8%
1 ene 1990 año
18.694
+0.692
3.85%
1 ene 1991 año
18.637
-0.057
-0.3%
1 ene 1992 año
18.198
-0.439
-2.36%
1 ene 1993 año
18.05
-0.148
-0.81%
1 ene 1994 año
17.686
-0.364
-2.02%
1 ene 1995 año
18.55
+0.864
4.88%
1 ene 1996 año
19.629
+1.078
5.81%
1 ene 1997 año
20.145
+0.517
2.63%
1 ene 1998 año
21.141
+0.996
4.94%
1 ene 1999 año
21.361
+0.22
1.04%
1 ene 2000 año
21.75
+0.389
1.82%
1 ene 2001 año
24.033
+2.283
10.49%
1 ene 2002 año
23.267
-0.766
-3.19%
1 ene 2003 año
22.529
-0.738
-3.17%
1 ene 2004 año
22.522
-0.007
-0.03%
1 ene 2005 año
23.72
+1.198
5.32%
1 ene 2006 año
24.943
+1.223
5.16%
1 ene 2007 año
26.468
+1.525
6.11%
1 ene 2008 año
26.948
+0.48
1.81%
1 ene 2009 año
28.263
+1.315
4.88%
1 ene 2010 año
24.024
-4.239
-15.0%
1 ene 2011 año
26.64
+2.616
10.89%
1 ene 2012 año
28.785
+2.145
8.05%
1 ene 2013 año
28.913
+0.129
0.45%
1 ene 2014 año
28.708
-0.205
-0.71%
1 ene 2015 año
28.852
+0.143
0.5%
1 ene 2016 año
28.156
-0.695
-2.41%
Ranking de los países por los datos estadísticos actuales


Comentarios: