29
/es/
es
AIzaSyAYiBZKx7MnpbEhh9jyipgxe19OcubqV5w
April 1, 2024
265874
Tonga
TON
true
2
1
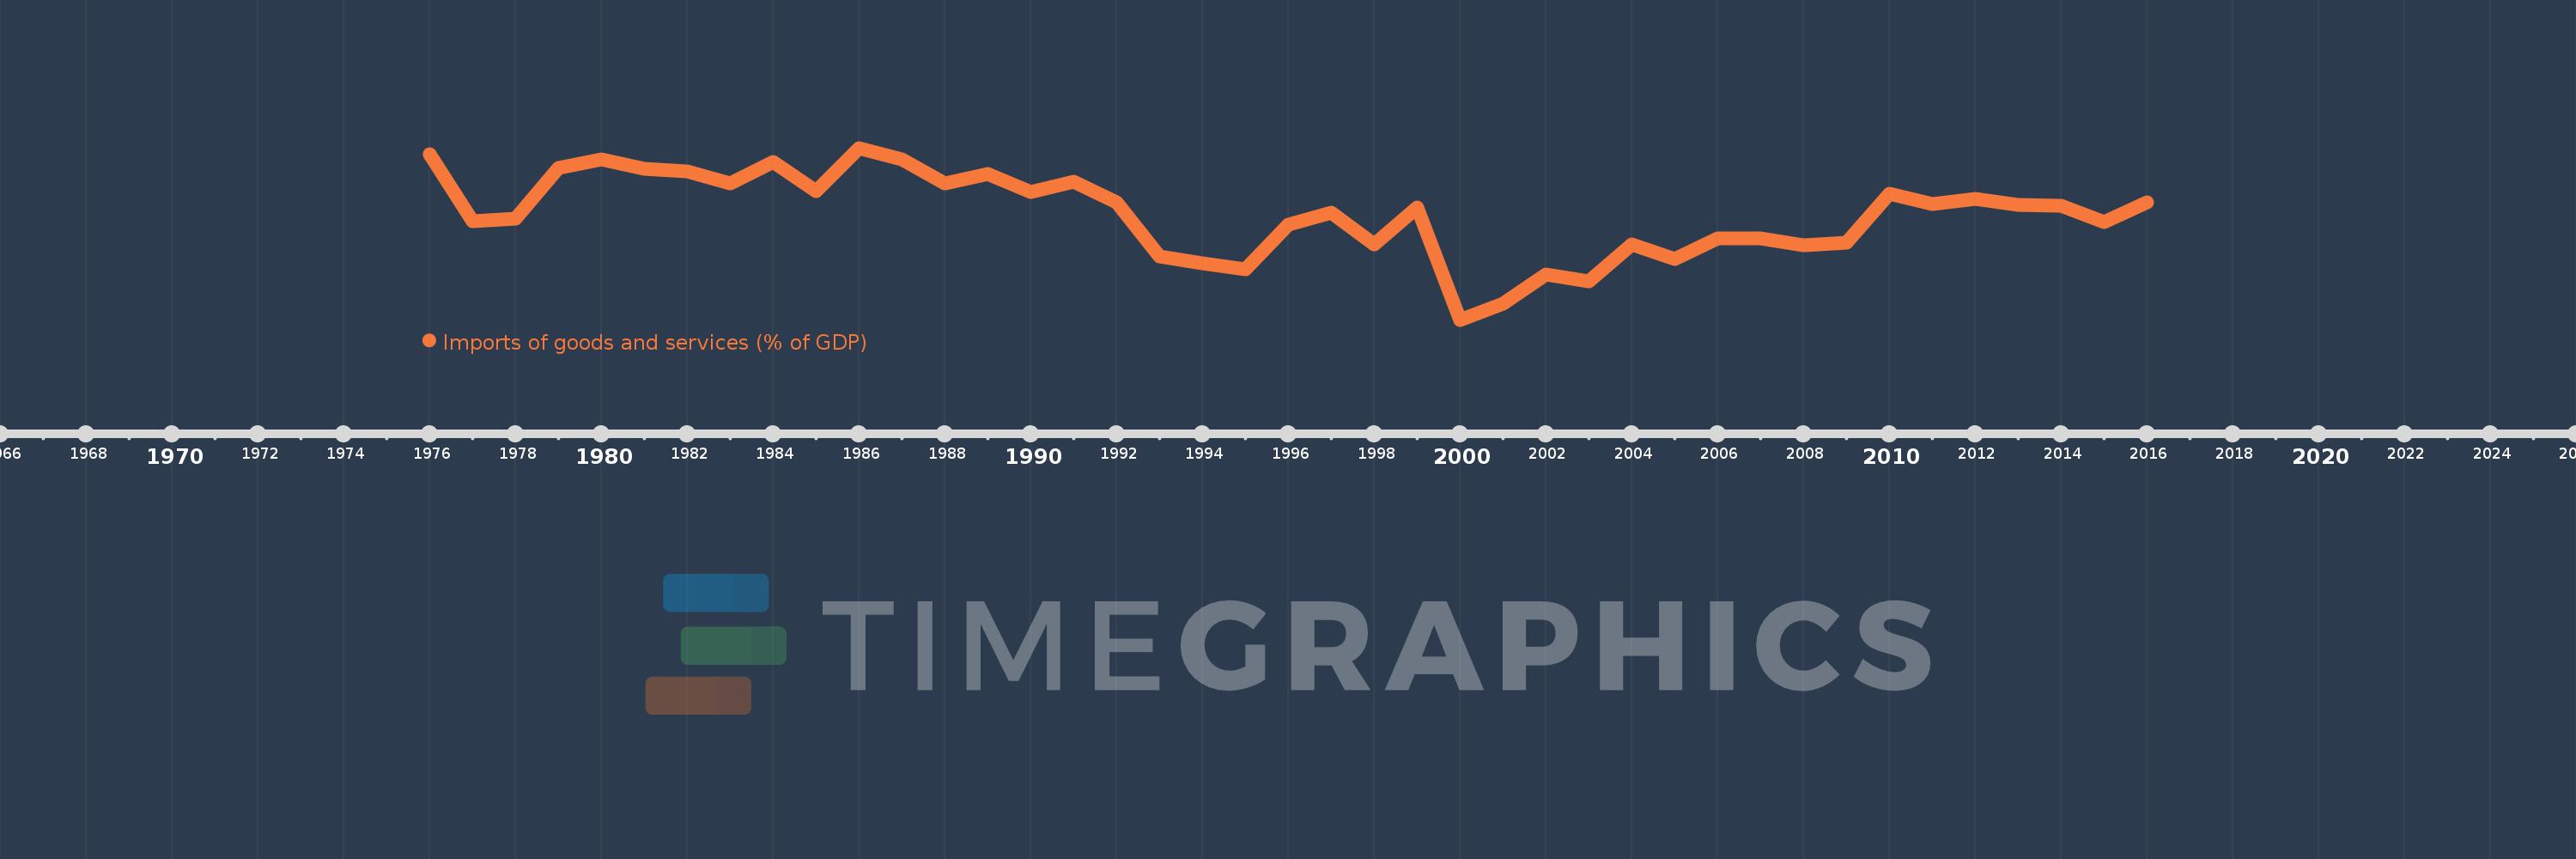
Imports of goods and services (% of GDP)
2016,2015,2014,2013,2012,2011,2010,2009,2008,2007,2006,2005,2004,2003,2002,2001,2000,1999,1998,1997,1996,1995,1994,1993,1992,1991,1990,1989,1988,1987,1986,1985,1984,1983,1982,1981,1980,1979,1978,1977,1976
Estas estadísticas en otros países:
AfghanistanAlbaniaAlgeriaAngolaAntigua and BarbudaArab WorldArgentinaArmeniaArubaAustraliaAustriaAzerbaijanBahamas, TheBahrainBangladeshBarbadosBelarusBelgiumBelizeBeninBermudaBhutanBoliviaBosnia and HerzegovinaBotswanaBrazilBrunei DarussalamBulgariaBurkina FasoBurundiCabo VerdeCambodiaCameroonCanadaCaribbean small statesCentral African RepublicCentral Europe and the BalticsChadChileChinaColombiaComorosCongo, Dem. Rep.Congo, Rep.Costa RicaCote d'IvoireCroatiaCubaCyprusCzech RepublicDenmarkDjiboutiDominicaDominican RepublicEarly-demographic dividendEast Asia & PacificEast Asia & Pacific (excluding high income)East Asia & Pacific (IDA & IBRD countries)EcuadorEgypt, Arab Rep.El SalvadorEquatorial GuineaEritreaEstoniaEthiopiaEuro areaEurope & Central AsiaEurope & Central Asia (excluding high income)Europe & Central Asia (IDA & IBRD countries)European UnionFaroe IslandsFijiFinlandFragile and conflict affected situationsFranceFrench PolynesiaGabonGambia, TheGeorgiaGermanyGhanaGreeceGrenadaGuatemalaGuineaGuinea-BissauGuyanaHaitiHeavily indebted poor countries (HIPC)High incomeHondurasHong Kong SAR, ChinaHungaryIBRD onlyIcelandIDA & IBRD totalIDA blendIDA onlyIDA totalIndiaIndonesiaIran, Islamic Rep.IraqIrelandIsraelItalyJamaicaJapanJordanKazakhstanKenyaKiribatiKorea, Rep.KosovoKuwaitKyrgyz RepublicLao PDRLate-demographic dividendLatin America & Caribbean Latin America & Caribbean (excluding high income)Latin America & the Caribbean (IDA & IBRD countries)LatviaLeast developed countries: UN classificationLebanonLesothoLiberiaLibyaLithuaniaLow & middle incomeLow incomeLower middle incomeLuxembourgMacao SAR, ChinaMacedonia, FYRMadagascarMalawiMalaysiaMaldivesMaliMaltaMauritaniaMauritiusMexicoMicronesia, Fed. Sts.Middle East & North AfricaMiddle East & North Africa (excluding high income)Middle East & North Africa (IDA & IBRD countries)Middle incomeMoldovaMongoliaMontenegroMoroccoMozambiqueMyanmarNamibiaNepalNetherlandsNew CaledoniaNew ZealandNicaraguaNigerNigeriaNorth AmericaNorwayOECD membersOmanOther small statesPacific island small statesPakistanPalauPanamaPapua New GuineaParaguayPeruPhilippinesPolandPortugalPost-demographic dividendPre-demographic dividendPuerto RicoQatarRomaniaRussian FederationRwandaSamoaSaudi ArabiaSenegalSerbiaSeychellesSierra LeoneSingaporeSlovak RepublicSloveniaSmall statesSolomon IslandsSomaliaSouth AfricaSouth AsiaSouth Asia (IDA & IBRD)South SudanSpainSri LankaSt. Kitts and NevisSt. LuciaSt. Vincent and the GrenadinesSub-Saharan Africa Sub-Saharan Africa (excluding high income)Sub-Saharan Africa (IDA & IBRD countries)SudanSurinameSwazilandSwedenSwitzerlandSyrian Arab RepublicTajikistanTanzaniaThailandTimor-LesteTogoTongaTrinidad and TobagoTunisiaTurkeyTurkmenistanUgandaUkraineUnited Arab EmiratesUnited KingdomUnited StatesUpper middle incomeUruguayUzbekistanVanuatuVenezuela, RBVietnamWest Bank and GazaWorldYemen, Rep.ZambiaZimbabwe línea de tiempo (timeline):
En esta escala de tiempo se presenta un gráfico de 1976 y 2016 de Tonga. Los datos de 1975 están ausentes. El número de observaciones reales por fecha: 41.
Fuente (nombre):
Indicadores del desarrollo mundial
Fuente (organización):
World Bank national accounts data, and OECD National Accounts data files.
Categorías:
Economy & Growth, Trade
Se ha actualizado:
23 abr 2017 año
Los indicadores de los cambios de valor en los últimos años
Mínimo:
35.544
1 ene 2000 año
Máximo:
72.231
1 ene 1986 año
A la fecha de observación
Valor
Cambio absoluto
El cambio con respecto al valor anterior
1 ene 1976 año
70.818
+70.818
0.0%
1 ene 1977 año
56.631
-14.188
-20.03%
1 ene 1978 año
57.177
+0.547
0.97%
1 ene 1979 año
67.873
+10.695
18.71%
1 ene 1980 año
69.803
+1.931
2.84%
1 ene 1981 año
67.719
-2.085
-2.99%
1 ene 1982 año
67.245
-0.473
-0.7%
1 ene 1983 año
64.625
-2.62
-3.9%
1 ene 1984 año
69.171
+4.546
7.03%
1 ene 1985 año
62.955
-6.216
-8.99%
1 ene 1986 año
72.231
+9.276
14.73%
1 ene 1987 año
69.876
-2.355
-3.26%
1 ene 1988 año
64.606
-5.27
-7.54%
1 ene 1989 año
66.749
+2.144
3.32%
1 ene 1990 año
62.806
-3.943
-5.91%
1 ene 1991 año
65.096
+2.29
3.65%
1 ene 1992 año
60.559
-4.537
-6.97%
1 ene 1993 año
48.989
-11.57
-19.11%
1 ene 1994 año
47.549
-1.439
-2.94%
1 ene 1995 año
46.298
-1.251
-2.63%
1 ene 1996 año
55.851
+9.553
20.63%
1 ene 1997 año
58.375
+2.524
4.52%
1 ene 1998 año
51.672
-6.704
-11.48%
1 ene 1999 año
59.58
+7.909
15.31%
1 ene 2000 año
35.544
-24.036
-40.34%
1 ene 2001 año
39.023
+3.479
9.79%
1 ene 2002 año
45.152
+6.129
15.71%
1 ene 2003 año
43.684
-1.468
-3.25%
1 ene 2004 año
51.642
+7.958
18.22%
1 ene 2005 año
48.5
-3.142
-6.08%
1 ene 2006 año
53.005
+4.505
9.29%
1 ene 2007 año
52.883
-0.122
-0.23%
1 ene 2008 año
51.509
-1.374
-2.6%
1 ene 2009 año
51.947
+0.438
0.85%
1 ene 2010 año
62.4
+10.453
20.12%
1 ene 2011 año
60.251
-2.149
-3.44%
1 ene 2012 año
61.29
+1.039
1.73%
1 ene 2013 año
60.002
-1.288
-2.1%
1 ene 2014 año
59.842
-0.16
-0.27%
1 ene 2015 año
56.475
-3.368
-5.63%
1 ene 2016 año
60.671
+4.196
7.43%
Ranking de los países por los datos estadísticos actuales


Comentarios: