29
/es/
es
AIzaSyAYiBZKx7MnpbEhh9jyipgxe19OcubqV5w
April 1, 2024
219689
Papua New Guinea
PNG
true
2
1
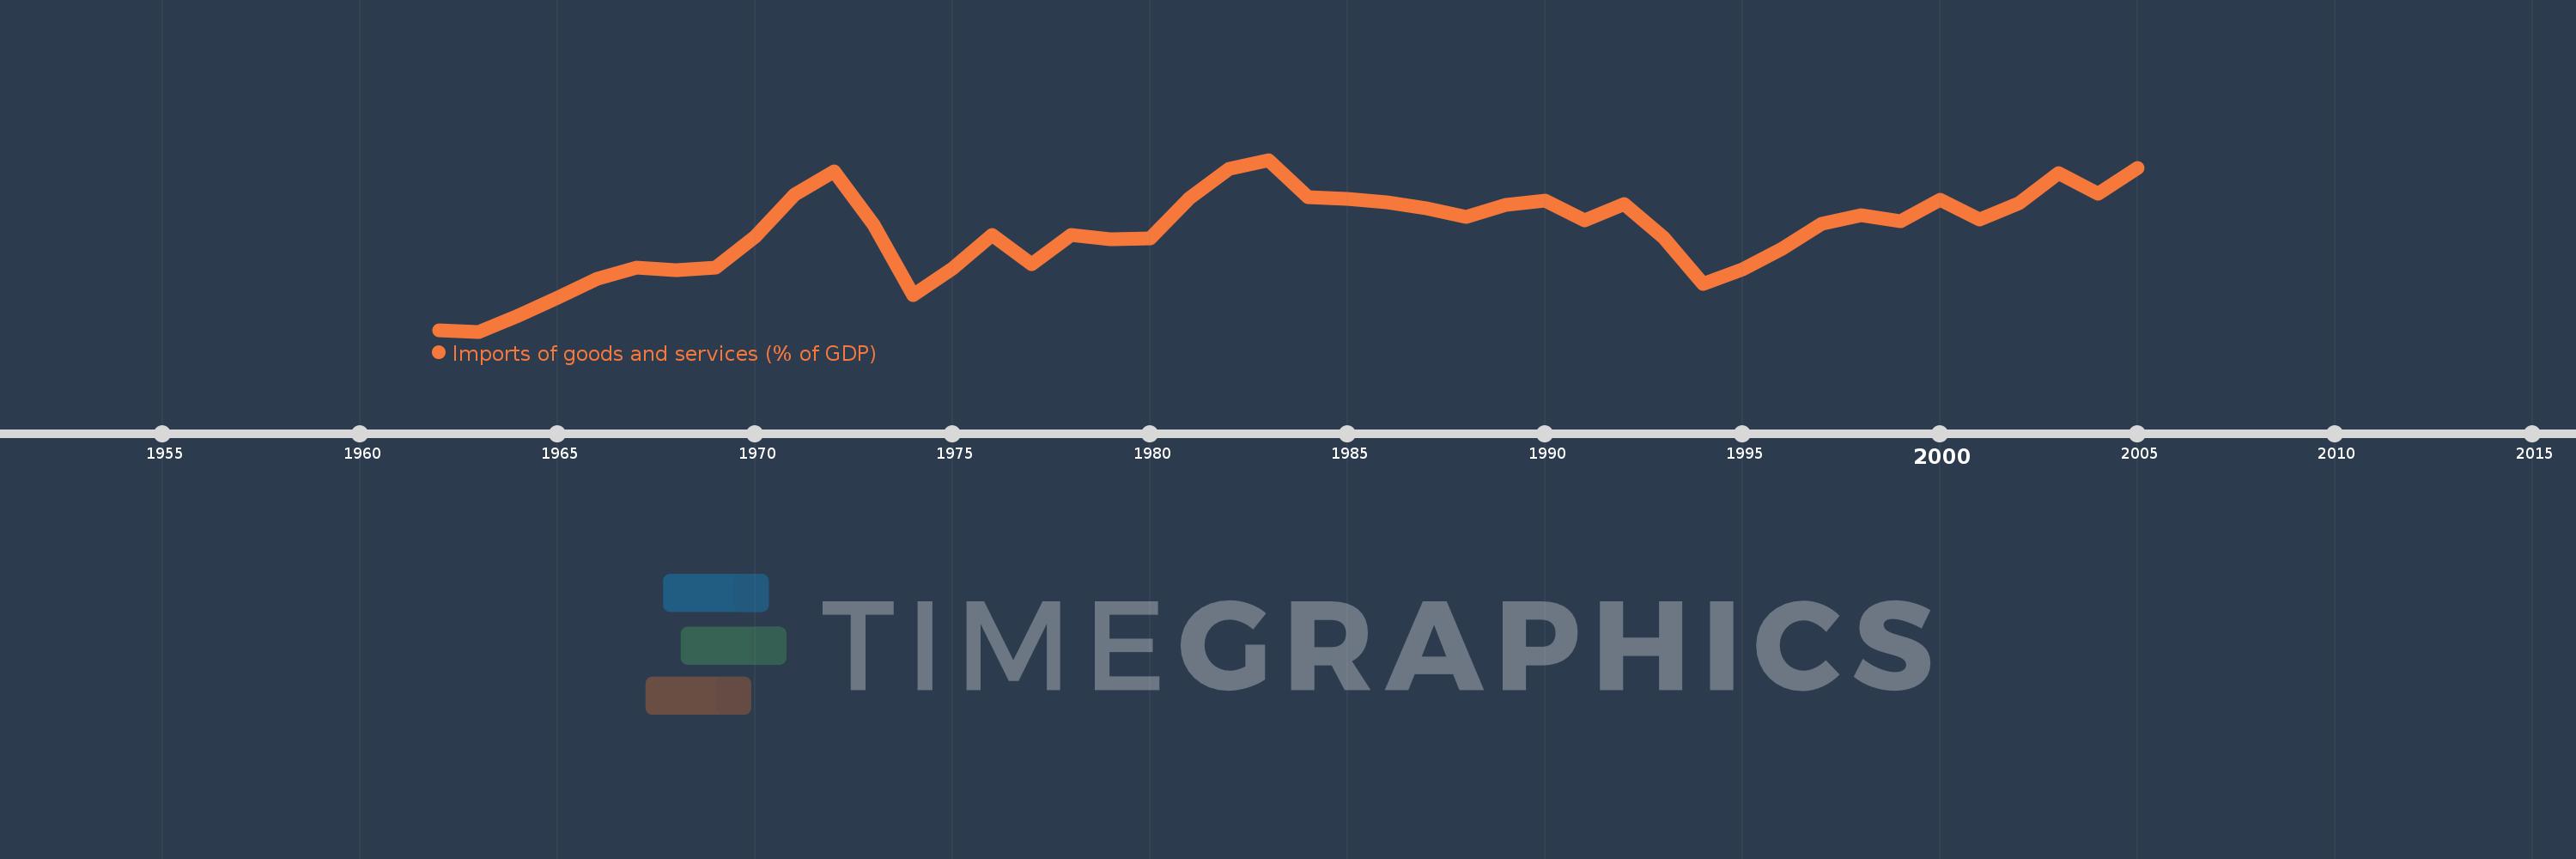
Imports of goods and services (% of GDP)
2005,2004,2003,2002,2001,2000,1999,1998,1997,1996,1995,1994,1993,1992,1991,1990,1989,1988,1987,1986,1985,1984,1983,1982,1981,1980,1979,1978,1977,1976,1975,1974,1973,1972,1971,1970,1969,1968,1967,1966,1965,1964,1963,1962
Estas estadísticas en otros países:
AfghanistanAlbaniaAlgeriaAngolaAntigua and BarbudaArab WorldArgentinaArmeniaArubaAustraliaAustriaAzerbaijanBahamas, TheBahrainBangladeshBarbadosBelarusBelgiumBelizeBeninBermudaBhutanBoliviaBosnia and HerzegovinaBotswanaBrazilBrunei DarussalamBulgariaBurkina FasoBurundiCabo VerdeCambodiaCameroonCanadaCaribbean small statesCentral African RepublicCentral Europe and the BalticsChadChileChinaColombiaComorosCongo, Dem. Rep.Congo, Rep.Costa RicaCote d'IvoireCroatiaCubaCyprusCzech RepublicDenmarkDjiboutiDominicaDominican RepublicEarly-demographic dividendEast Asia & PacificEast Asia & Pacific (excluding high income)East Asia & Pacific (IDA & IBRD countries)EcuadorEgypt, Arab Rep.El SalvadorEquatorial GuineaEritreaEstoniaEthiopiaEuro areaEurope & Central AsiaEurope & Central Asia (excluding high income)Europe & Central Asia (IDA & IBRD countries)European UnionFaroe IslandsFijiFinlandFragile and conflict affected situationsFranceFrench PolynesiaGabonGambia, TheGeorgiaGermanyGhanaGreeceGrenadaGuatemalaGuineaGuinea-BissauGuyanaHaitiHeavily indebted poor countries (HIPC)High incomeHondurasHong Kong SAR, ChinaHungaryIBRD onlyIcelandIDA & IBRD totalIDA blendIDA onlyIDA totalIndiaIndonesiaIran, Islamic Rep.IraqIrelandIsraelItalyJamaicaJapanJordanKazakhstanKenyaKiribatiKorea, Rep.KosovoKuwaitKyrgyz RepublicLao PDRLate-demographic dividendLatin America & Caribbean Latin America & Caribbean (excluding high income)Latin America & the Caribbean (IDA & IBRD countries)LatviaLeast developed countries: UN classificationLebanonLesothoLiberiaLibyaLithuaniaLow & middle incomeLow incomeLower middle incomeLuxembourgMacao SAR, ChinaMacedonia, FYRMadagascarMalawiMalaysiaMaldivesMaliMaltaMauritaniaMauritiusMexicoMicronesia, Fed. Sts.Middle East & North AfricaMiddle East & North Africa (excluding high income)Middle East & North Africa (IDA & IBRD countries)Middle incomeMoldovaMongoliaMontenegroMoroccoMozambiqueMyanmarNamibiaNepalNetherlandsNew CaledoniaNew ZealandNicaraguaNigerNigeriaNorth AmericaNorwayOECD membersOmanOther small statesPacific island small statesPakistanPalauPanamaPapua New GuineaParaguayPeruPhilippinesPolandPortugalPost-demographic dividendPre-demographic dividendPuerto RicoQatarRomaniaRussian FederationRwandaSamoaSaudi ArabiaSenegalSerbiaSeychellesSierra LeoneSingaporeSlovak RepublicSloveniaSmall statesSolomon IslandsSomaliaSouth AfricaSouth AsiaSouth Asia (IDA & IBRD)South SudanSpainSri LankaSt. Kitts and NevisSt. LuciaSt. Vincent and the GrenadinesSub-Saharan Africa Sub-Saharan Africa (excluding high income)Sub-Saharan Africa (IDA & IBRD countries)SudanSurinameSwazilandSwedenSwitzerlandSyrian Arab RepublicTajikistanTanzaniaThailandTimor-LesteTogoTongaTrinidad and TobagoTunisiaTurkeyTurkmenistanUgandaUkraineUnited Arab EmiratesUnited KingdomUnited StatesUpper middle incomeUruguayUzbekistanVanuatuVenezuela, RBVietnamWest Bank and GazaWorldYemen, Rep.ZambiaZimbabwe línea de tiempo (timeline):
En esta escala de tiempo se presenta un gráfico de 1962 y 2005 de Papua New Guinea. Los datos de 1961 están ausentes. El número de observaciones reales por fecha: 44.
Fuente (nombre):
Indicadores del desarrollo mundial
Fuente (organización):
World Bank national accounts data, and OECD National Accounts data files.
Categorías:
Economy & Growth, Trade
Se ha actualizado:
23 abr 2017 año
Los indicadores de los cambios de valor en los últimos años
Mínimo:
27.916
1 ene 1963 año
Máximo:
60.496
1 ene 1983 año
A la fecha de observación
Valor
Cambio absoluto
El cambio con respecto al valor anterior
1 ene 1962 año
28.134
+28.134
0.0%
1 ene 1963 año
27.916
-0.218
-0.77%
1 ene 1964 año
30.966
+3.05
10.93%
1 ene 1965 año
34.299
+3.333
10.76%
1 ene 1966 año
37.976
+3.677
10.72%
1 ene 1967 año
40.132
+2.156
5.68%
1 ene 1968 año
39.63
-0.502
-1.25%
1 ene 1969 año
40.074
+0.444
1.12%
1 ene 1970 año
45.896
+5.822
14.53%
1 ene 1971 año
53.938
+8.042
17.52%
1 ene 1972 año
58.239
+4.3
7.97%
1 ene 1973 año
48.25
-9.989
-17.15%
1 ene 1974 año
34.82
-13.43
-27.83%
1 ene 1975 año
39.842
+5.021
14.42%
1 ene 1976 año
46.164
+6.323
15.87%
1 ene 1977 año
40.781
-5.383
-11.66%
1 ene 1978 año
46.269
+5.488
13.46%
1 ene 1979 año
45.42
-0.849
-1.84%
1 ene 1980 año
45.59
+0.17
0.37%
1 ene 1981 año
53.322
+7.733
16.96%
1 ene 1982 año
58.744
+5.421
10.17%
1 ene 1983 año
60.496
+1.752
2.98%
1 ene 1984 año
53.452
-7.045
-11.64%
1 ene 1985 año
53.146
-0.306
-0.57%
1 ene 1986 año
52.44
-0.705
-1.33%
1 ene 1987 año
51.355
-1.085
-2.07%
1 ene 1988 año
49.672
-1.682
-3.28%
1 ene 1989 año
51.923
+2.25
4.53%
1 ene 1990 año
52.746
+0.824
1.59%
1 ene 1991 año
48.947
-3.8
-7.2%
1 ene 1992 año
52.155
+3.208
6.55%
1 ene 1993 año
45.702
-6.453
-12.37%
1 ene 1994 año
36.946
-8.756
-19.16%
1 ene 1995 año
39.768
+2.822
7.64%
1 ene 1996 año
43.701
+3.933
9.89%
1 ene 1997 año
48.399
+4.698
10.75%
1 ene 1998 año
50.05
+1.652
3.41%
1 ene 1999 año
48.819
-1.231
-2.46%
1 ene 2000 año
52.888
+4.069
8.33%
1 ene 2001 año
49.243
-3.645
-6.89%
1 ene 2002 año
52.25
+3.007
6.11%
1 ene 2003 año
58.003
+5.753
11.01%
1 ene 2004 año
54.031
-3.972
-6.85%
1 ene 2005 año
58.919
+4.888
9.05%
Ranking de los países por los datos estadísticos actuales


Comentarios: