29
/es/
es
AIzaSyAYiBZKx7MnpbEhh9jyipgxe19OcubqV5w
April 1, 2024
103722
Chad
TCD
true
2
1
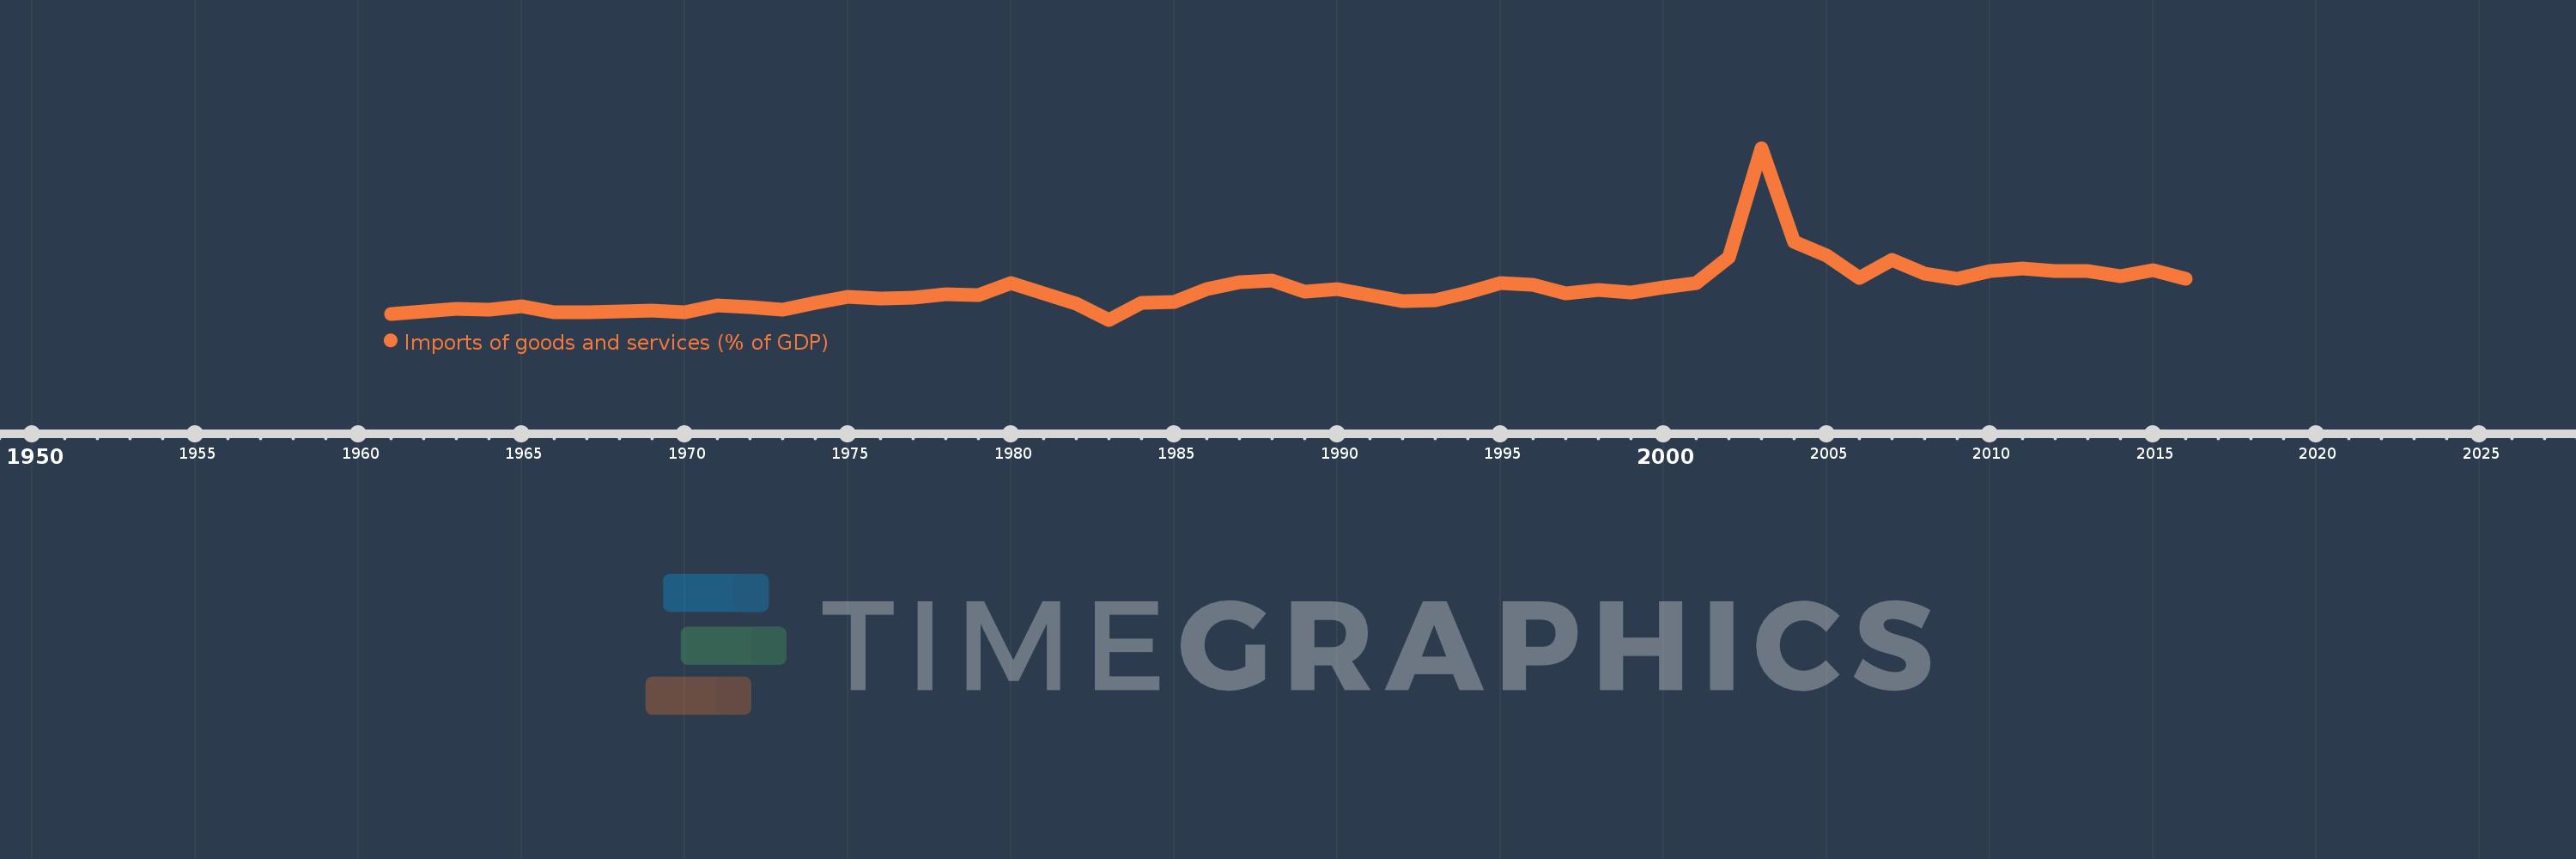
Imports of goods and services (% of GDP)
2016,2015,2014,2013,2012,2011,2010,2009,2008,2007,2006,2005,2004,2003,2002,2001,2000,1999,1998,1997,1996,1995,1994,1993,1992,1991,1990,1989,1988,1987,1986,1985,1984,1983,1982,1981,1980,1979,1978,1977,1976,1975,1974,1973,1972,1971,1970,1969,1968,1967,1966,1965,1964,1963,1962,1961
Estas estadísticas en otros países:
AfghanistanAlbaniaAlgeriaAngolaAntigua and BarbudaArab WorldArgentinaArmeniaArubaAustraliaAustriaAzerbaijanBahamas, TheBahrainBangladeshBarbadosBelarusBelgiumBelizeBeninBermudaBhutanBoliviaBosnia and HerzegovinaBotswanaBrazilBrunei DarussalamBulgariaBurkina FasoBurundiCabo VerdeCambodiaCameroonCanadaCaribbean small statesCentral African RepublicCentral Europe and the BalticsChadChileChinaColombiaComorosCongo, Dem. Rep.Congo, Rep.Costa RicaCote d'IvoireCroatiaCubaCyprusCzech RepublicDenmarkDjiboutiDominicaDominican RepublicEarly-demographic dividendEast Asia & PacificEast Asia & Pacific (excluding high income)East Asia & Pacific (IDA & IBRD countries)EcuadorEgypt, Arab Rep.El SalvadorEquatorial GuineaEritreaEstoniaEthiopiaEuro areaEurope & Central AsiaEurope & Central Asia (excluding high income)Europe & Central Asia (IDA & IBRD countries)European UnionFaroe IslandsFijiFinlandFragile and conflict affected situationsFranceFrench PolynesiaGabonGambia, TheGeorgiaGermanyGhanaGreeceGrenadaGuatemalaGuineaGuinea-BissauGuyanaHaitiHeavily indebted poor countries (HIPC)High incomeHondurasHong Kong SAR, ChinaHungaryIBRD onlyIcelandIDA & IBRD totalIDA blendIDA onlyIDA totalIndiaIndonesiaIran, Islamic Rep.IraqIrelandIsraelItalyJamaicaJapanJordanKazakhstanKenyaKiribatiKorea, Rep.KosovoKuwaitKyrgyz RepublicLao PDRLate-demographic dividendLatin America & Caribbean Latin America & Caribbean (excluding high income)Latin America & the Caribbean (IDA & IBRD countries)LatviaLeast developed countries: UN classificationLebanonLesothoLiberiaLibyaLithuaniaLow & middle incomeLow incomeLower middle incomeLuxembourgMacao SAR, ChinaMacedonia, FYRMadagascarMalawiMalaysiaMaldivesMaliMaltaMauritaniaMauritiusMexicoMicronesia, Fed. Sts.Middle East & North AfricaMiddle East & North Africa (excluding high income)Middle East & North Africa (IDA & IBRD countries)Middle incomeMoldovaMongoliaMontenegroMoroccoMozambiqueMyanmarNamibiaNepalNetherlandsNew CaledoniaNew ZealandNicaraguaNigerNigeriaNorth AmericaNorwayOECD membersOmanOther small statesPacific island small statesPakistanPalauPanamaPapua New GuineaParaguayPeruPhilippinesPolandPortugalPost-demographic dividendPre-demographic dividendPuerto RicoQatarRomaniaRussian FederationRwandaSamoaSaudi ArabiaSenegalSerbiaSeychellesSierra LeoneSingaporeSlovak RepublicSloveniaSmall statesSolomon IslandsSomaliaSouth AfricaSouth AsiaSouth Asia (IDA & IBRD)South SudanSpainSri LankaSt. Kitts and NevisSt. LuciaSt. Vincent and the GrenadinesSub-Saharan Africa Sub-Saharan Africa (excluding high income)Sub-Saharan Africa (IDA & IBRD countries)SudanSurinameSwazilandSwedenSwitzerlandSyrian Arab RepublicTajikistanTanzaniaThailandTimor-LesteTogoTongaTrinidad and TobagoTunisiaTurkeyTurkmenistanUgandaUkraineUnited Arab EmiratesUnited KingdomUnited StatesUpper middle incomeUruguayUzbekistanVanuatuVenezuela, RBVietnamWest Bank and GazaWorldYemen, Rep.ZambiaZimbabwe línea de tiempo (timeline):
En esta escala de tiempo se presenta un gráfico de 1961 y 2016 de Chad. Los datos de 1960 están ausentes. El número de observaciones reales por fecha: 56.
Fuente (nombre):
Indicadores del desarrollo mundial
Fuente (organización):
World Bank national accounts data, and OECD National Accounts data files.
Categorías:
Economy & Growth, Trade
Se ha actualizado:
23 abr 2017 año
Los indicadores de los cambios de valor en los últimos años
Mínimo:
13.495
1 ene 1983 año
Máximo:
113.661
1 ene 2003 año
A la fecha de observación
Valor
Cambio absoluto
El cambio con respecto al valor anterior
1 ene 1961 año
17.038
+17.038
0.0%
1 ene 1962 año
18.557
+1.519
8.92%
1 ene 1963 año
19.629
+1.072
5.78%
1 ene 1964 año
19.212
-0.417
-2.12%
1 ene 1965 año
21.329
+2.117
11.02%
1 ene 1966 año
17.813
-3.516
-16.49%
1 ene 1967 año
17.963
+0.15
0.84%
1 ene 1968 año
18.164
+0.201
1.12%
1 ene 1969 año
18.685
+0.521
2.87%
1 ene 1970 año
17.699
-0.986
-5.28%
1 ene 1971 año
22.05
+4.351
24.58%
1 ene 1972 año
21.058
-0.992
-4.5%
1 ene 1973 año
19.384
-1.674
-7.95%
1 ene 1974 año
23.5
+4.116
21.23%
1 ene 1975 año
26.804
+3.303
14.06%
1 ene 1976 año
25.851
-0.953
-3.56%
1 ene 1977 año
26.384
+0.534
2.06%
1 ene 1978 año
28.373
+1.988
7.54%
1 ene 1979 año
27.968
-0.405
-1.43%
1 ene 1980 año
34.638
+6.67
23.85%
1 ene 1981 año
28.866
-5.772
-16.66%
1 ene 1982 año
22.661
-6.204
-21.49%
1 ene 1983 año
13.495
-9.166
-40.45%
1 ene 1984 año
23.542
+10.047
74.45%
1 ene 1985 año
24.053
+0.512
2.17%
1 ene 1986 año
31.327
+7.274
30.24%
1 ene 1987 año
35.376
+4.049
12.92%
1 ene 1988 año
36.432
+1.057
2.99%
1 ene 1989 año
30.104
-6.328
-17.37%
1 ene 1990 año
31.409
+1.304
4.33%
1 ene 1991 año
27.907
-3.502
-11.15%
1 ene 1992 año
24.398
-3.509
-12.57%
1 ene 1993 año
24.814
+0.416
1.7%
1 ene 1994 año
29.324
+4.51
18.18%
1 ene 1995 año
34.883
+5.559
18.96%
1 ene 1996 año
33.768
-1.115
-3.2%
1 ene 1997 año
29.067
-4.701
-13.92%
1 ene 1998 año
30.769
+1.703
5.86%
1 ene 1999 año
29.567
-1.202
-3.91%
1 ene 2000 año
32.19
+2.622
8.87%
1 ene 2001 año
34.681
+2.491
7.74%
1 ene 2002 año
49.656
+14.975
43.18%
1 ene 2003 año
113.661
+64.005
128.9%
1 ene 2004 año
58.746
-54.915
-48.31%
1 ene 2005 año
50.76
-7.986
-13.59%
1 ene 2006 año
37.869
-12.89
-25.39%
1 ene 2007 año
48.329
+10.459
27.62%
1 ene 2008 año
40.228
-8.101
-16.76%
1 ene 2009 año
37.595
-2.632
-6.54%
1 ene 2010 año
41.971
+4.376
11.64%
1 ene 2011 año
43.545
+1.574
3.75%
1 ene 2012 año
41.804
-1.741
-4.0%
1 ene 2013 año
42.108
+0.304
0.73%
1 ene 2014 año
39.083
-3.024
-7.18%
1 ene 2015 año
42.465
+3.382
8.65%
1 ene 2016 año
37.319
-5.147
-12.12%
Ranking de los países por los datos estadísticos actuales


Comentarios: