29
/es/
es
AIzaSyAYiBZKx7MnpbEhh9jyipgxe19OcubqV5w
April 1, 2024
194351
Mauritius
MUS
true
2
1
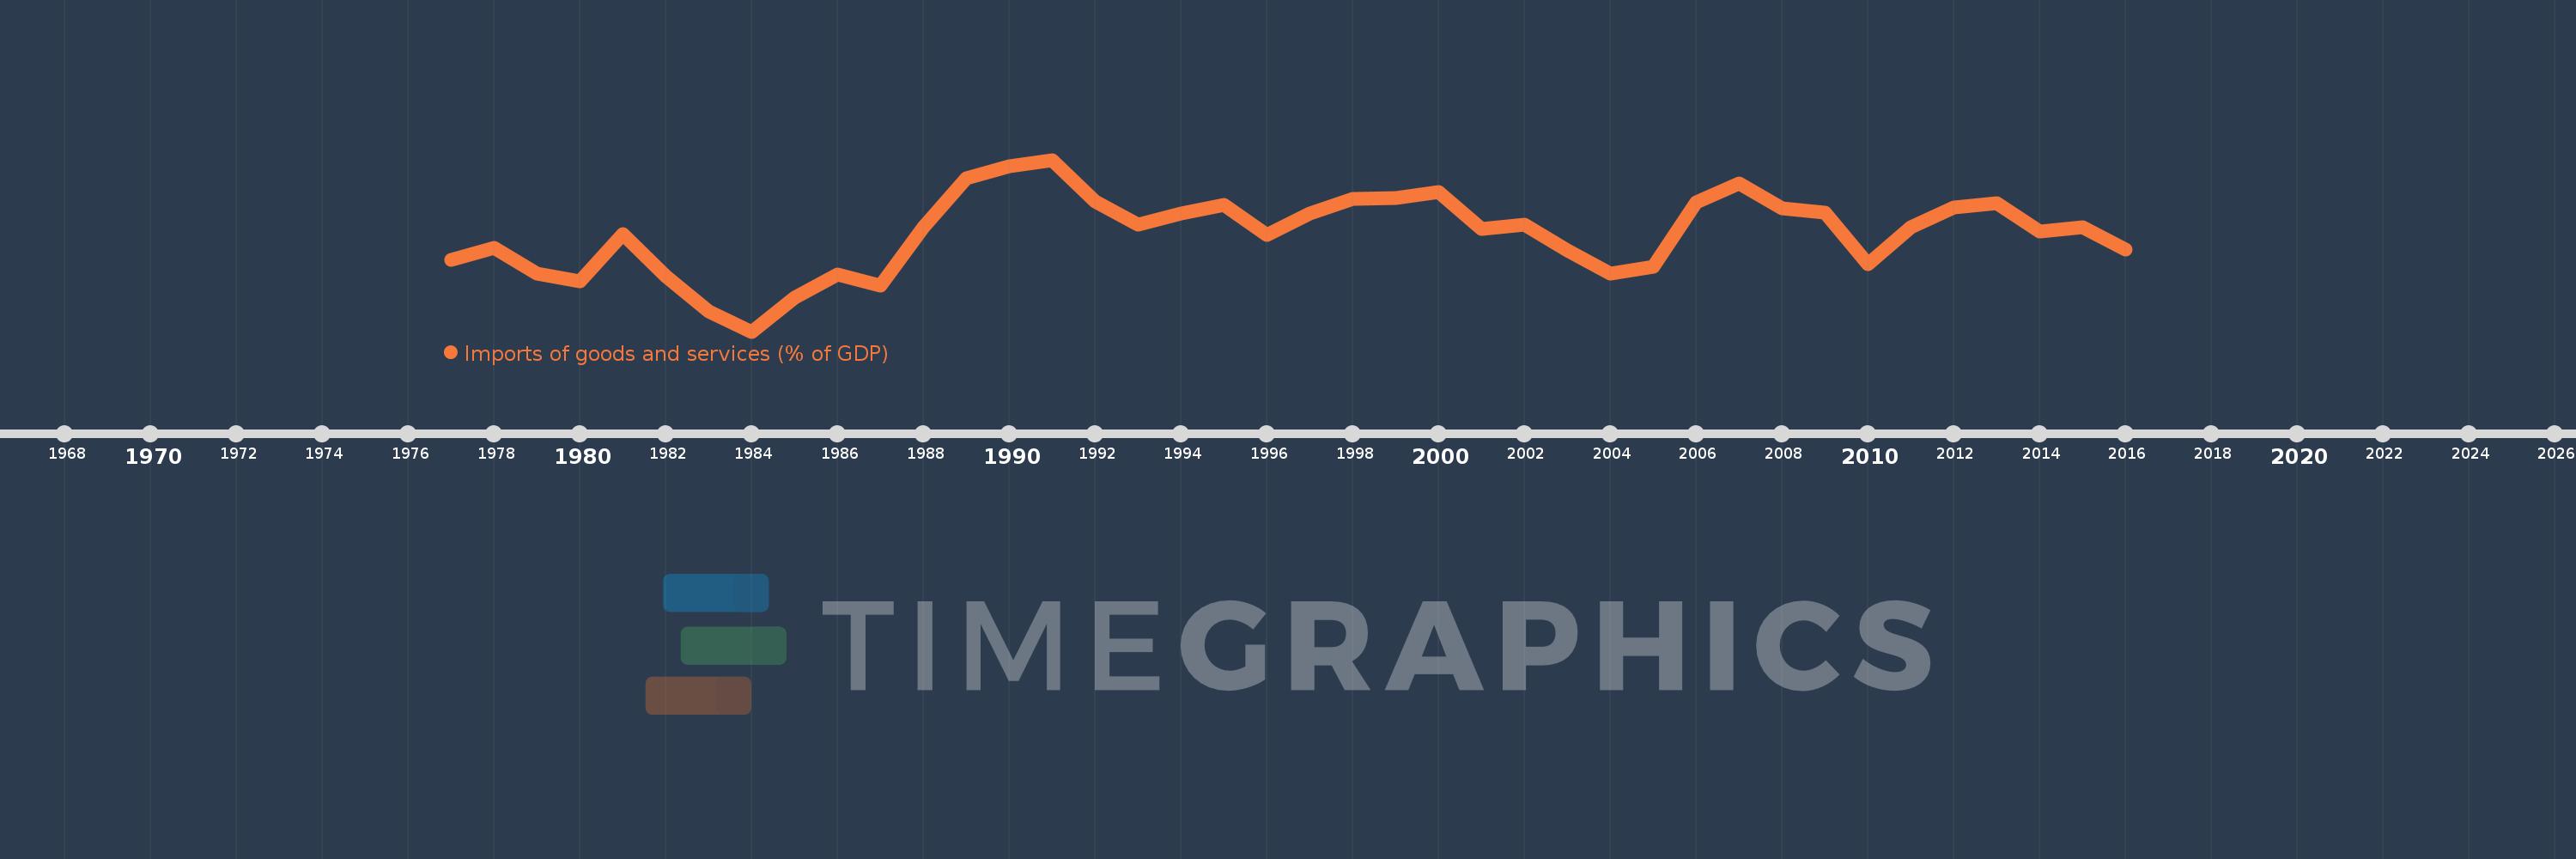
Imports of goods and services (% of GDP)
2016,2015,2014,2013,2012,2011,2010,2009,2008,2007,2006,2005,2004,2003,2002,2001,2000,1999,1998,1997,1996,1995,1994,1993,1992,1991,1990,1989,1988,1987,1986,1985,1984,1983,1982,1981,1980,1979,1978,1977
Estas estadísticas en otros países:
AfghanistanAlbaniaAlgeriaAngolaAntigua and BarbudaArab WorldArgentinaArmeniaArubaAustraliaAustriaAzerbaijanBahamas, TheBahrainBangladeshBarbadosBelarusBelgiumBelizeBeninBermudaBhutanBoliviaBosnia and HerzegovinaBotswanaBrazilBrunei DarussalamBulgariaBurkina FasoBurundiCabo VerdeCambodiaCameroonCanadaCaribbean small statesCentral African RepublicCentral Europe and the BalticsChadChileChinaColombiaComorosCongo, Dem. Rep.Congo, Rep.Costa RicaCote d'IvoireCroatiaCubaCyprusCzech RepublicDenmarkDjiboutiDominicaDominican RepublicEarly-demographic dividendEast Asia & PacificEast Asia & Pacific (excluding high income)East Asia & Pacific (IDA & IBRD countries)EcuadorEgypt, Arab Rep.El SalvadorEquatorial GuineaEritreaEstoniaEthiopiaEuro areaEurope & Central AsiaEurope & Central Asia (excluding high income)Europe & Central Asia (IDA & IBRD countries)European UnionFaroe IslandsFijiFinlandFragile and conflict affected situationsFranceFrench PolynesiaGabonGambia, TheGeorgiaGermanyGhanaGreeceGrenadaGuatemalaGuineaGuinea-BissauGuyanaHaitiHeavily indebted poor countries (HIPC)High incomeHondurasHong Kong SAR, ChinaHungaryIBRD onlyIcelandIDA & IBRD totalIDA blendIDA onlyIDA totalIndiaIndonesiaIran, Islamic Rep.IraqIrelandIsraelItalyJamaicaJapanJordanKazakhstanKenyaKiribatiKorea, Rep.KosovoKuwaitKyrgyz RepublicLao PDRLate-demographic dividendLatin America & Caribbean Latin America & Caribbean (excluding high income)Latin America & the Caribbean (IDA & IBRD countries)LatviaLeast developed countries: UN classificationLebanonLesothoLiberiaLibyaLithuaniaLow & middle incomeLow incomeLower middle incomeLuxembourgMacao SAR, ChinaMacedonia, FYRMadagascarMalawiMalaysiaMaldivesMaliMaltaMauritaniaMauritiusMexicoMicronesia, Fed. Sts.Middle East & North AfricaMiddle East & North Africa (excluding high income)Middle East & North Africa (IDA & IBRD countries)Middle incomeMoldovaMongoliaMontenegroMoroccoMozambiqueMyanmarNamibiaNepalNetherlandsNew CaledoniaNew ZealandNicaraguaNigerNigeriaNorth AmericaNorwayOECD membersOmanOther small statesPacific island small statesPakistanPalauPanamaPapua New GuineaParaguayPeruPhilippinesPolandPortugalPost-demographic dividendPre-demographic dividendPuerto RicoQatarRomaniaRussian FederationRwandaSamoaSaudi ArabiaSenegalSerbiaSeychellesSierra LeoneSingaporeSlovak RepublicSloveniaSmall statesSolomon IslandsSomaliaSouth AfricaSouth AsiaSouth Asia (IDA & IBRD)South SudanSpainSri LankaSt. Kitts and NevisSt. LuciaSt. Vincent and the GrenadinesSub-Saharan Africa Sub-Saharan Africa (excluding high income)Sub-Saharan Africa (IDA & IBRD countries)SudanSurinameSwazilandSwedenSwitzerlandSyrian Arab RepublicTajikistanTanzaniaThailandTimor-LesteTogoTongaTrinidad and TobagoTunisiaTurkeyTurkmenistanUgandaUkraineUnited Arab EmiratesUnited KingdomUnited StatesUpper middle incomeUruguayUzbekistanVanuatuVenezuela, RBVietnamWest Bank and GazaWorldYemen, Rep.ZambiaZimbabwe línea de tiempo (timeline):
En esta escala de tiempo se presenta un gráfico de 1977 y 2016 de Mauritius. Los datos de 1976 están ausentes. El número de observaciones reales por fecha: 40.
Fuente (nombre):
Indicadores del desarrollo mundial
Fuente (organización):
World Bank national accounts data, and OECD National Accounts data files.
Categorías:
Economy & Growth, Trade
Se ha actualizado:
23 abr 2017 año
Los indicadores de los cambios de valor en los últimos años
Mínimo:
46.806
1 ene 1984 año
Máximo:
72.155
1 ene 1991 año
A la fecha de observación
Valor
Cambio absoluto
El cambio con respecto al valor anterior
1 ene 1977 año
57.412
+57.412
0.0%
1 ene 1978 año
59.196
+1.784
3.11%
1 ene 1979 año
55.328
-3.868
-6.53%
1 ene 1980 año
54.196
-1.132
-2.05%
1 ene 1981 año
61.167
+6.97
12.86%
1 ene 1982 año
54.956
-6.211
-10.15%
1 ene 1983 año
49.761
-5.195
-9.45%
1 ene 1984 año
46.806
-2.955
-5.94%
1 ene 1985 año
51.802
+4.995
10.67%
1 ene 1986 año
55.19
+3.388
6.54%
1 ene 1987 año
53.617
-1.573
-2.85%
1 ene 1988 año
62.248
+8.63
16.1%
1 ene 1989 año
69.394
+7.147
11.48%
1 ene 1990 año
71.231
+1.837
2.65%
1 ene 1991 año
72.155
+0.924
1.3%
1 ene 1992 año
66.049
-6.106
-8.46%
1 ene 1993 año
62.547
-3.502
-5.3%
1 ene 1994 año
64.282
+1.735
2.77%
1 ene 1995 año
65.461
+1.179
1.83%
1 ene 1996 año
61.082
-4.379
-6.69%
1 ene 1997 año
64.272
+3.19
5.22%
1 ene 1998 año
66.343
+2.071
3.22%
1 ene 1999 año
66.515
+0.172
0.26%
1 ene 2000 año
67.416
+0.901
1.35%
1 ene 2001 año
61.944
-5.472
-8.12%
1 ene 2002 año
62.534
+0.589
0.95%
1 ene 2003 año
58.783
-3.751
-6.0%
1 ene 2004 año
55.387
-3.395
-5.78%
1 ene 2005 año
56.393
+1.005
1.81%
1 ene 2006 año
65.858
+9.465
16.78%
1 ene 2007 año
68.619
+2.761
4.19%
1 ene 2008 año
65.009
-3.61
-5.26%
1 ene 2009 año
64.419
-0.59
-0.91%
1 ene 2010 año
56.753
-7.666
-11.9%
1 ene 2011 año
62.219
+5.467
9.63%
1 ene 2012 año
65.095
+2.875
4.62%
1 ene 2013 año
65.708
+0.613
0.94%
1 ene 2014 año
61.552
-4.156
-6.32%
1 ene 2015 año
62.23
+0.678
1.1%
1 ene 2016 año
58.907
-3.323
-5.34%
Ranking de los países por los datos estadísticos actuales


Comentarios: