29
/es/
es
AIzaSyAYiBZKx7MnpbEhh9jyipgxe19OcubqV5w
April 1, 2024
48736
Middle East & North Africa (excluding high income)
MNA
false
2
1
Arable land (% of land area)
2015,2014,2013,2012,2011,2010,2009,2008,2007,2006,2005,2004,2003,2002,2001,2000,1999,1998,1997,1996,1995,1994,1993,1992,1991,1990,1989,1988,1987,1986,1985,1984,1983,1982,1981,1980,1979,1978,1977,1976,1975,1974,1973,1972,1971,1970,1969,1968,1967,1966,1965,1964,1963,1962
Estas estadísticas en otros países:
AfghanistanAlbaniaAlgeriaAmerican SamoaAndorraAngolaAntigua and BarbudaArab WorldArgentinaArmeniaArubaAustraliaAustriaAzerbaijanBahamas, TheBahrainBangladeshBarbadosBelarusBelgiumBelizeBeninBermudaBhutanBoliviaBosnia and HerzegovinaBotswanaBrazilBritish Virgin IslandsBrunei DarussalamBulgariaBurkina FasoBurundiCabo VerdeCambodiaCameroonCanadaCaribbean small statesCayman IslandsCentral African RepublicCentral Europe and the BalticsChadChannel IslandsChileChinaColombiaComorosCongo, Dem. Rep.Congo, Rep.Costa RicaCote d'IvoireCroatiaCubaCyprusCzech RepublicDenmarkDjiboutiDominicaDominican RepublicEarly-demographic dividendEast Asia & PacificEast Asia & Pacific (excluding high income)East Asia & Pacific (IDA & IBRD countries)EcuadorEgypt, Arab Rep.El SalvadorEquatorial GuineaEritreaEstoniaEthiopiaEuro areaEurope & Central AsiaEurope & Central Asia (excluding high income)Europe & Central Asia (IDA & IBRD countries)European UnionFaroe IslandsFijiFinlandFragile and conflict affected situationsFranceFrench PolynesiaGabonGambia, TheGeorgiaGermanyGhanaGreeceGreenlandGrenadaGuamGuatemalaGuineaGuinea-BissauGuyanaHaitiHeavily indebted poor countries (HIPC)High incomeHondurasHong Kong SAR, ChinaHungaryIBRD onlyIcelandIDA & IBRD totalIDA blendIDA onlyIDA totalIndiaIndonesiaIran, Islamic Rep.IraqIrelandIsle of ManIsraelItalyJamaicaJapanJordanKazakhstanKenyaKiribatiKorea, Dem. People’s Rep.Korea, Rep.KosovoKuwaitKyrgyz RepublicLao PDRLate-demographic dividendLatin America & Caribbean Latin America & Caribbean (excluding high income)Latin America & the Caribbean (IDA & IBRD countries)LatviaLeast developed countries: UN classificationLebanonLesothoLiberiaLibyaLiechtensteinLithuaniaLow & middle incomeLow incomeLower middle incomeLuxembourgMacedonia, FYRMadagascarMalawiMalaysiaMaldivesMaliMaltaMarshall IslandsMauritaniaMauritiusMexicoMicronesia, Fed. Sts.Middle East & North AfricaMiddle East & North Africa (excluding high income)Middle East & North Africa (IDA & IBRD countries)Middle incomeMoldovaMongoliaMontenegroMoroccoMozambiqueMyanmarNamibiaNepalNetherlandsNew CaledoniaNew ZealandNicaraguaNigerNigeriaNorth AmericaNorthern Mariana IslandsNorwayOECD membersOmanOther small statesPacific island small statesPakistanPalauPanamaPapua New GuineaParaguayPeruPhilippinesPolandPortugalPost-demographic dividendPre-demographic dividendPuerto RicoQatarRomaniaRussian FederationRwandaSamoaSan MarinoSao Tome and PrincipeSaudi ArabiaSenegalSerbiaSeychellesSierra LeoneSingaporeSlovak RepublicSloveniaSmall statesSolomon IslandsSomaliaSouth AfricaSouth AsiaSouth Asia (IDA & IBRD)SpainSri LankaSt. Kitts and NevisSt. LuciaSt. Vincent and the GrenadinesSub-Saharan Africa Sub-Saharan Africa (excluding high income)Sub-Saharan Africa (IDA & IBRD countries)SudanSurinameSwazilandSwedenSwitzerlandSyrian Arab RepublicTajikistanTanzaniaThailandTimor-LesteTogoTongaTrinidad and TobagoTunisiaTurkeyTurkmenistanTurks and Caicos IslandsUgandaUkraineUnited Arab EmiratesUnited KingdomUnited StatesUpper middle incomeUruguayUzbekistanVanuatuVenezuela, RBVietnamVirgin Islands (U.S.)West Bank and GazaWorldYemen, Rep.ZambiaZimbabwe línea de tiempo (timeline):
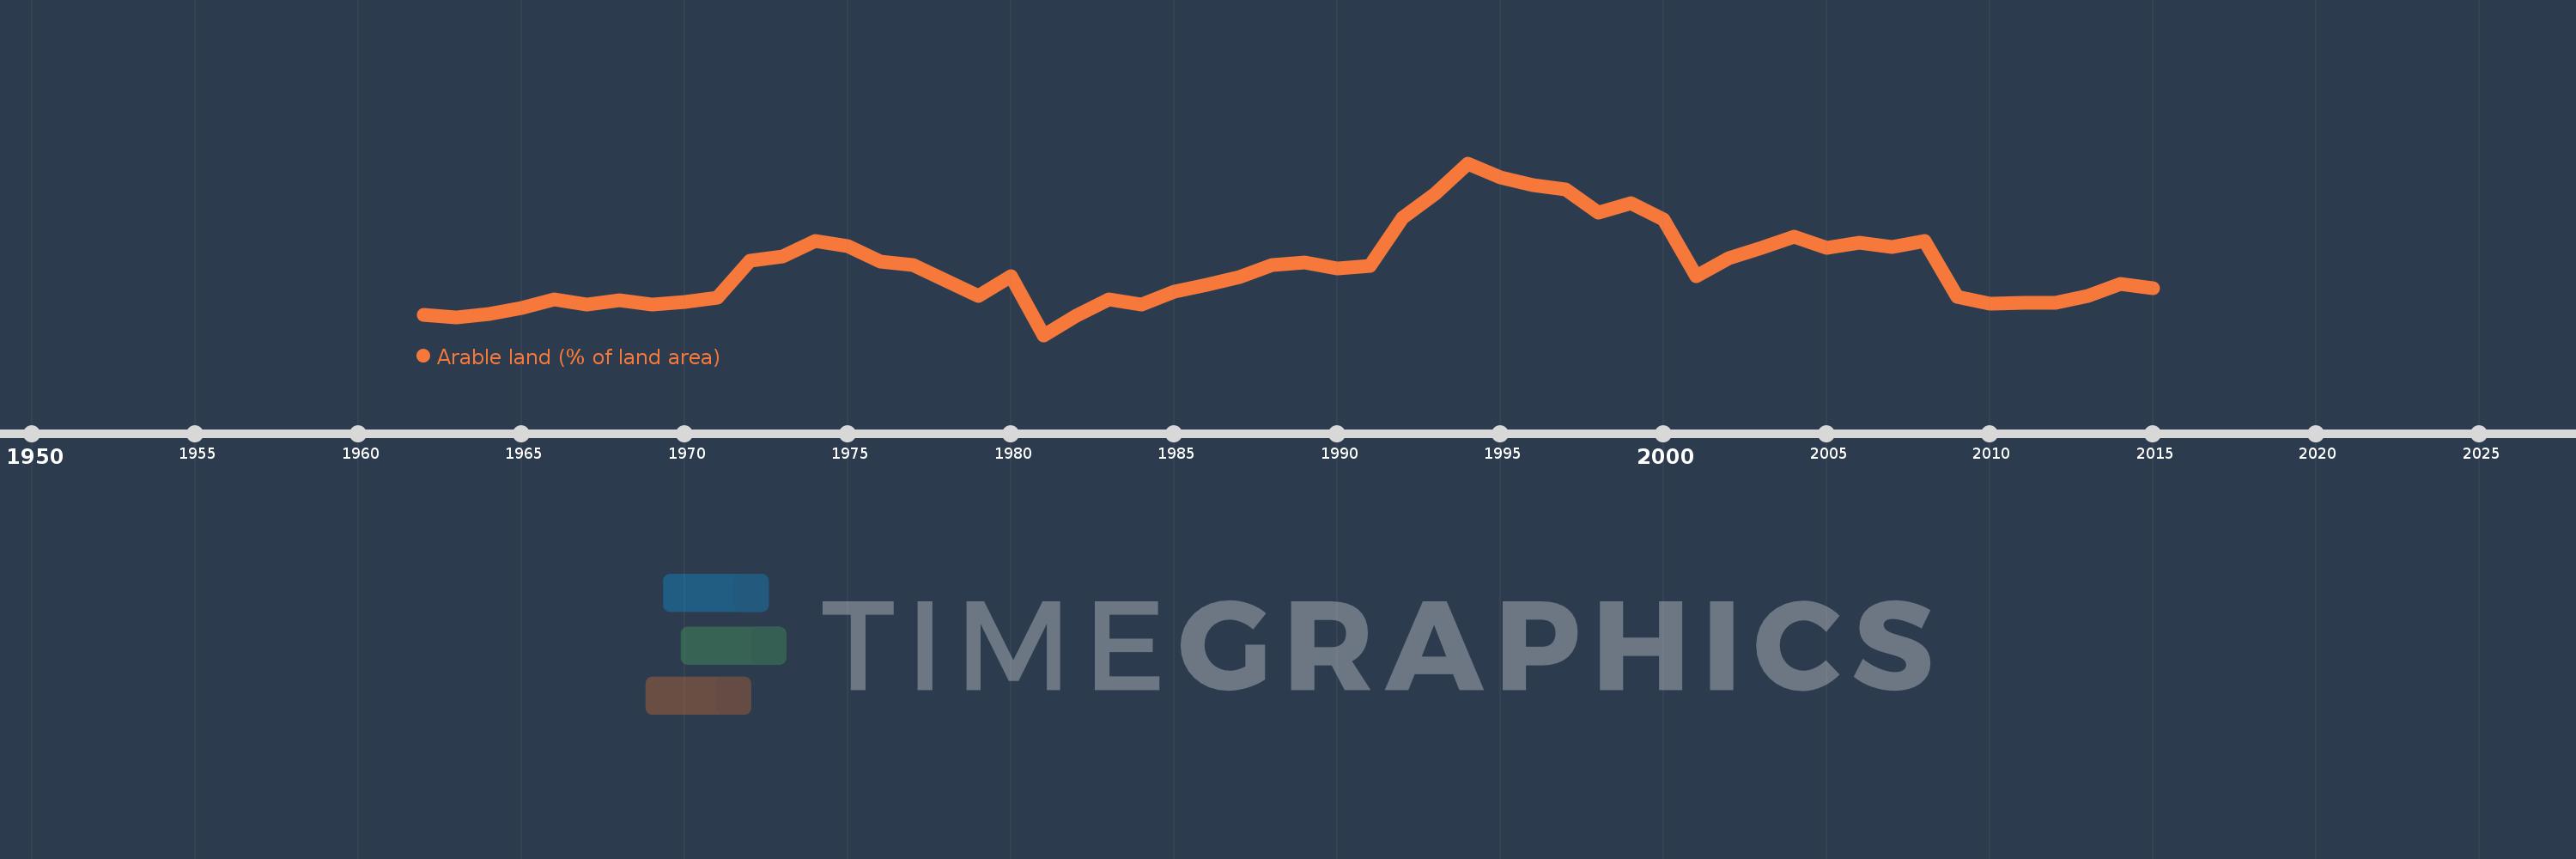
En esta escala de tiempo se presenta un gráfico de 1962 y 2015 de Middle East & North Africa (excluding high income). Los datos de 1961 están ausentes. El número de observaciones reales por fecha: 54.
Fuente (nombre):
Indicadores del desarrollo mundial
Fuente (organización):
Food and Agriculture Organization, electronic files and web site.
Categorías:
Agriculture & Rural Development, Climate Change, Environment
Se ha actualizado:
23 abr 2017 año
Los indicadores de los cambios de valor en los últimos años
Mínimo:
5.446
1 ene 1981 año
Máximo:
6.249
1 ene 1994 año
A la fecha de observación
Valor
Cambio absoluto
El cambio con respecto al valor anterior
1 ene 1962 año
5.541
+5.541
0.0%
1 ene 1963 año
5.53
-0.011
-0.19%
1 ene 1964 año
5.543
+0.013
0.24%
1 ene 1965 año
5.574
+0.031
0.56%
1 ene 1966 año
5.614
+0.04
0.73%
1 ene 1967 año
5.588
-0.026
-0.47%
1 ene 1968 año
5.609
+0.021
0.38%
1 ene 1969 año
5.587
-0.022
-0.4%
1 ene 1970 año
5.6
+0.013
0.23%
1 ene 1971 año
5.619
+0.019
0.34%
1 ene 1972 año
5.793
+0.174
3.09%
1 ene 1973 año
5.812
+0.019
0.33%
1 ene 1974 año
5.887
+0.075
1.29%
1 ene 1975 año
5.861
-0.026
-0.44%
1 ene 1976 año
5.79
-0.071
-1.22%
1 ene 1977 año
5.773
-0.016
-0.28%
1 ene 1978 año
5.699
-0.074
-1.28%
1 ene 1979 año
5.627
-0.073
-1.27%
1 ene 1980 año
5.723
+0.096
1.71%
1 ene 1981 año
5.446
-0.277
-4.84%
1 ene 1982 año
5.537
+0.091
1.67%
1 ene 1983 año
5.613
+0.075
1.36%
1 ene 1984 año
5.59
-0.023
-0.41%
1 ene 1985 año
5.649
+0.059
1.05%
1 ene 1986 año
5.68
+0.032
0.56%
1 ene 1987 año
5.719
+0.039
0.69%
1 ene 1988 año
5.774
+0.055
0.96%
1 ene 1989 año
5.784
+0.01
0.17%
1 ene 1990 año
5.757
-0.027
-0.46%
1 ene 1991 año
5.768
+0.011
0.19%
1 ene 1992 año
5.994
+0.226
3.92%
1 ene 1993 año
6.107
+0.113
1.89%
1 ene 1994 año
6.249
+0.142
2.33%
1 ene 1995 año
6.181
-0.069
-1.1%
1 ene 1996 año
6.147
-0.034
-0.54%
1 ene 1997 año
6.126
-0.021
-0.34%
1 ene 1998 año
6.02
-0.106
-1.73%
1 ene 1999 año
6.062
+0.042
0.7%
1 ene 2000 año
5.988
-0.074
-1.22%
1 ene 2001 año
5.72
-0.269
-4.48%
1 ene 2002 año
5.807
+0.087
1.53%
1 ene 2003 año
5.852
+0.045
0.77%
1 ene 2004 año
5.907
+0.055
0.94%
1 ene 2005 año
5.854
-0.053
-0.89%
1 ene 2006 año
5.877
+0.022
0.38%
1 ene 2007 año
5.856
-0.021
-0.35%
1 ene 2008 año
5.884
+0.028
0.49%
1 ene 2009 año
5.624
-0.26
-4.42%
1 ene 2010 año
5.592
-0.032
-0.58%
1 ene 2011 año
5.595
+0.003
0.06%
1 ene 2012 año
5.595
+0.0
0.01%
1 ene 2013 año
5.629
+0.034
0.6%
1 ene 2014 año
5.684
+0.055
0.98%
1 ene 2015 año
5.665
-0.019
-0.33%
Ranking de los países por los datos estadísticos actuales


Comentarios: