29
/es/
es
AIzaSyAYiBZKx7MnpbEhh9jyipgxe19OcubqV5w
April 1, 2024
225628
Portugal
PRT
true
2
1
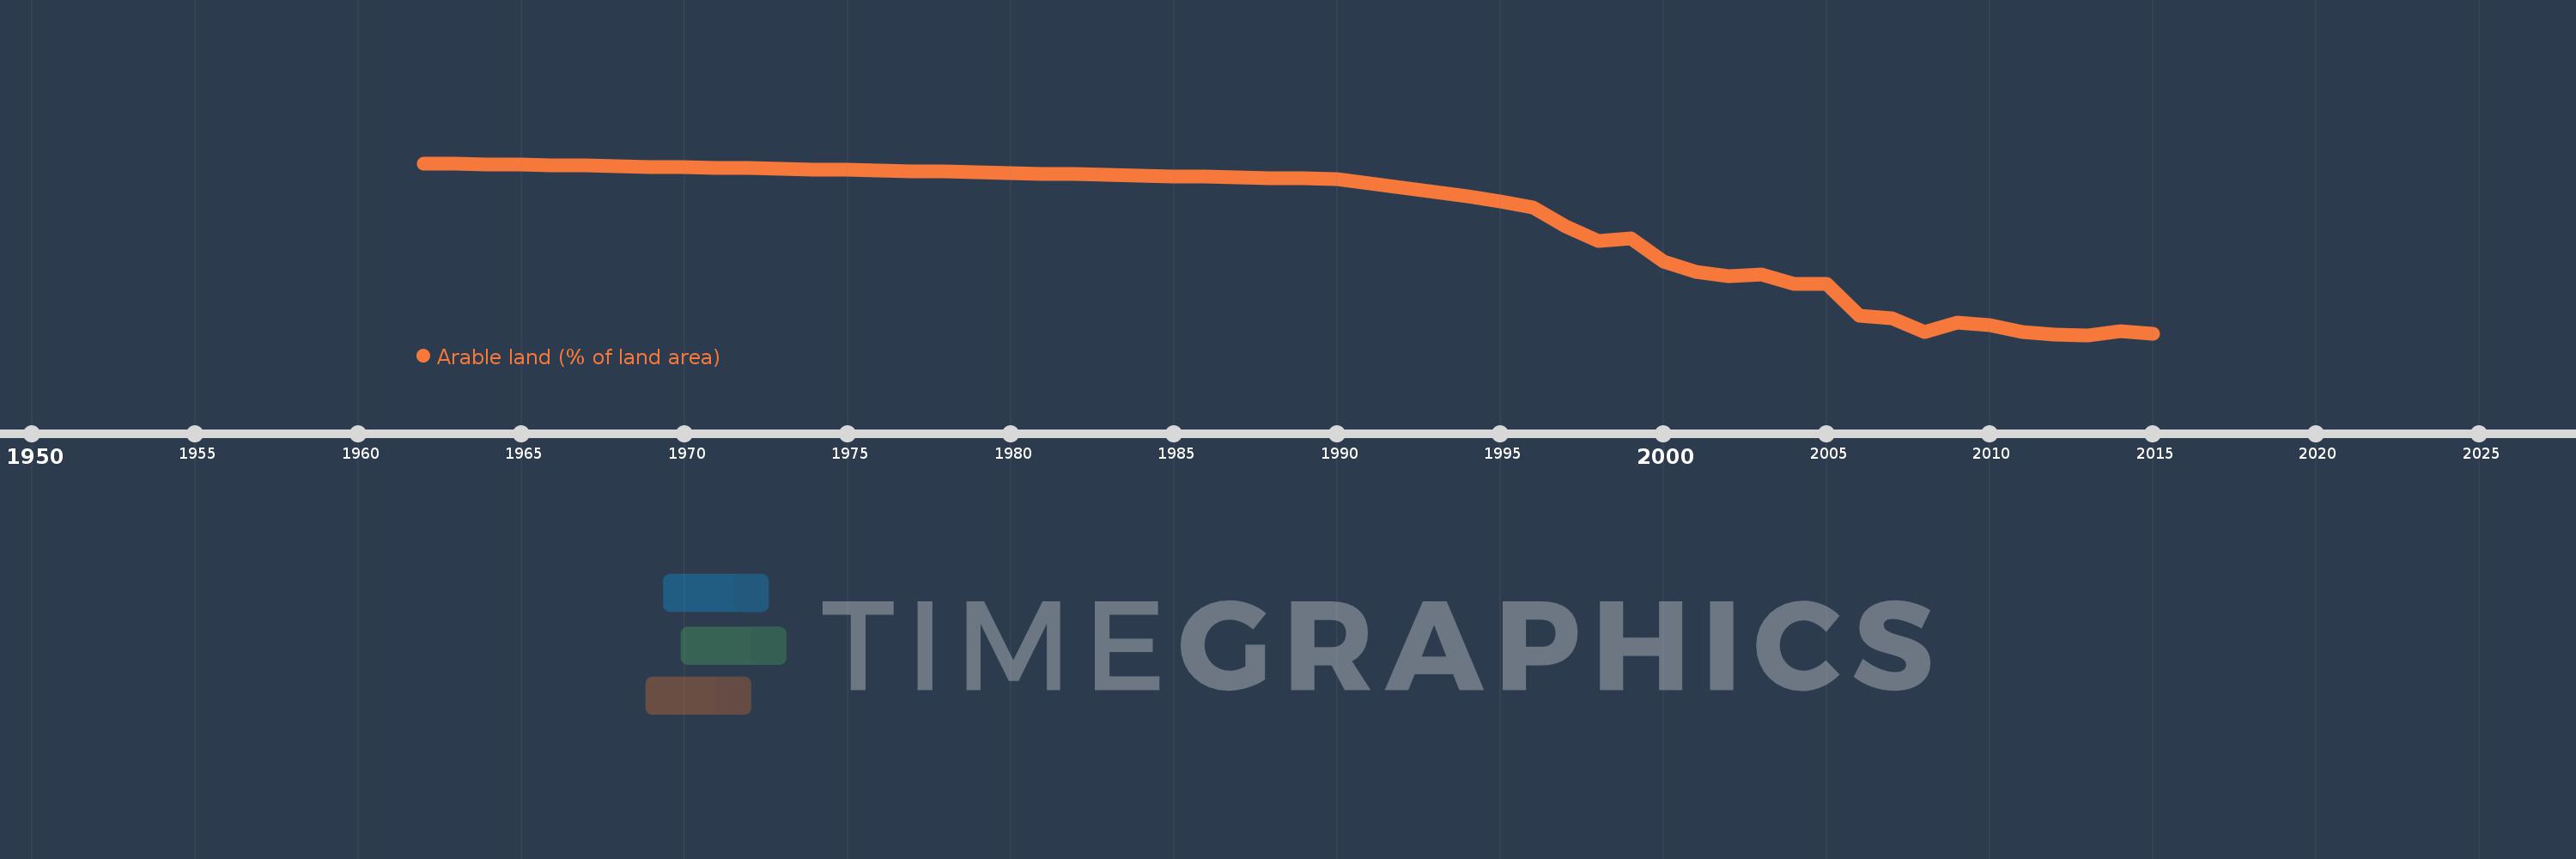
Arable land (% of land area)
2015,2014,2013,2012,2011,2010,2009,2008,2007,2006,2005,2004,2003,2002,2001,2000,1999,1998,1997,1996,1995,1994,1993,1992,1991,1990,1989,1988,1987,1986,1985,1984,1983,1982,1981,1980,1979,1978,1977,1976,1975,1974,1973,1972,1971,1970,1969,1968,1967,1966,1965,1964,1963,1962
Estas estadísticas en otros países:
AfghanistanAlbaniaAlgeriaAmerican SamoaAndorraAngolaAntigua and BarbudaArab WorldArgentinaArmeniaArubaAustraliaAustriaAzerbaijanBahamas, TheBahrainBangladeshBarbadosBelarusBelgiumBelizeBeninBermudaBhutanBoliviaBosnia and HerzegovinaBotswanaBrazilBritish Virgin IslandsBrunei DarussalamBulgariaBurkina FasoBurundiCabo VerdeCambodiaCameroonCanadaCaribbean small statesCayman IslandsCentral African RepublicCentral Europe and the BalticsChadChannel IslandsChileChinaColombiaComorosCongo, Dem. Rep.Congo, Rep.Costa RicaCote d'IvoireCroatiaCubaCyprusCzech RepublicDenmarkDjiboutiDominicaDominican RepublicEarly-demographic dividendEast Asia & PacificEast Asia & Pacific (excluding high income)East Asia & Pacific (IDA & IBRD countries)EcuadorEgypt, Arab Rep.El SalvadorEquatorial GuineaEritreaEstoniaEthiopiaEuro areaEurope & Central AsiaEurope & Central Asia (excluding high income)Europe & Central Asia (IDA & IBRD countries)European UnionFaroe IslandsFijiFinlandFragile and conflict affected situationsFranceFrench PolynesiaGabonGambia, TheGeorgiaGermanyGhanaGreeceGreenlandGrenadaGuamGuatemalaGuineaGuinea-BissauGuyanaHaitiHeavily indebted poor countries (HIPC)High incomeHondurasHong Kong SAR, ChinaHungaryIBRD onlyIcelandIDA & IBRD totalIDA blendIDA onlyIDA totalIndiaIndonesiaIran, Islamic Rep.IraqIrelandIsle of ManIsraelItalyJamaicaJapanJordanKazakhstanKenyaKiribatiKorea, Dem. People’s Rep.Korea, Rep.KosovoKuwaitKyrgyz RepublicLao PDRLate-demographic dividendLatin America & Caribbean Latin America & Caribbean (excluding high income)Latin America & the Caribbean (IDA & IBRD countries)LatviaLeast developed countries: UN classificationLebanonLesothoLiberiaLibyaLiechtensteinLithuaniaLow & middle incomeLow incomeLower middle incomeLuxembourgMacedonia, FYRMadagascarMalawiMalaysiaMaldivesMaliMaltaMarshall IslandsMauritaniaMauritiusMexicoMicronesia, Fed. Sts.Middle East & North AfricaMiddle East & North Africa (excluding high income)Middle East & North Africa (IDA & IBRD countries)Middle incomeMoldovaMongoliaMontenegroMoroccoMozambiqueMyanmarNamibiaNepalNetherlandsNew CaledoniaNew ZealandNicaraguaNigerNigeriaNorth AmericaNorthern Mariana IslandsNorwayOECD membersOmanOther small statesPacific island small statesPakistanPalauPanamaPapua New GuineaParaguayPeruPhilippinesPolandPortugalPost-demographic dividendPre-demographic dividendPuerto RicoQatarRomaniaRussian FederationRwandaSamoaSan MarinoSao Tome and PrincipeSaudi ArabiaSenegalSerbiaSeychellesSierra LeoneSingaporeSlovak RepublicSloveniaSmall statesSolomon IslandsSomaliaSouth AfricaSouth AsiaSouth Asia (IDA & IBRD)SpainSri LankaSt. Kitts and NevisSt. LuciaSt. Vincent and the GrenadinesSub-Saharan Africa Sub-Saharan Africa (excluding high income)Sub-Saharan Africa (IDA & IBRD countries)SudanSurinameSwazilandSwedenSwitzerlandSyrian Arab RepublicTajikistanTanzaniaThailandTimor-LesteTogoTongaTrinidad and TobagoTunisiaTurkeyTurkmenistanTurks and Caicos IslandsUgandaUkraineUnited Arab EmiratesUnited KingdomUnited StatesUpper middle incomeUruguayUzbekistanVanuatuVenezuela, RBVietnamVirgin Islands (U.S.)West Bank and GazaWorldYemen, Rep.ZambiaZimbabwe línea de tiempo (timeline):
En esta escala de tiempo se presenta un gráfico de 1962 y 2015 de Portugal. Los datos de 1961 están ausentes. El número de observaciones reales por fecha: 54.
Fuente (nombre):
Indicadores del desarrollo mundial
Fuente (organización):
Food and Agriculture Organization, electronic files and web site.
Categorías:
Agriculture & Rural Development, Climate Change, Environment
Se ha actualizado:
23 abr 2017 año
Los indicadores de los cambios de valor en los últimos años
Mínimo:
12.27
1 ene 2013 año
Máximo:
27.399
1 ene 1962 año
A la fecha de observación
Valor
Cambio absoluto
El cambio con respecto al valor anterior
1 ene 1962 año
27.399
+27.399
0.0%
1 ene 1963 año
27.355
-0.044
-0.16%
1 ene 1964 año
27.311
-0.044
-0.16%
1 ene 1965 año
27.268
-0.044
-0.16%
1 ene 1966 año
27.224
-0.044
-0.16%
1 ene 1967 año
27.18
-0.044
-0.16%
1 ene 1968 año
27.137
-0.044
-0.16%
1 ene 1969 año
27.093
-0.044
-0.16%
1 ene 1970 año
27.049
-0.044
-0.16%
1 ene 1971 año
27.005
-0.044
-0.16%
1 ene 1972 año
26.962
-0.044
-0.16%
1 ene 1973 año
26.918
-0.044
-0.16%
1 ene 1974 año
26.863
-0.055
-0.2%
1 ene 1975 año
26.809
-0.055
-0.2%
1 ene 1976 año
26.754
-0.055
-0.2%
1 ene 1977 año
26.699
-0.055
-0.2%
1 ene 1978 año
26.645
-0.055
-0.2%
1 ene 1979 año
26.59
-0.055
-0.21%
1 ene 1980 año
26.536
-0.055
-0.21%
1 ene 1981 año
26.481
-0.055
-0.21%
1 ene 1982 año
26.426
-0.055
-0.21%
1 ene 1983 año
26.372
-0.055
-0.21%
1 ene 1984 año
26.317
-0.055
-0.21%
1 ene 1985 año
26.262
-0.055
-0.21%
1 ene 1986 año
26.208
-0.055
-0.21%
1 ene 1987 año
26.153
-0.055
-0.21%
1 ene 1988 año
26.098
-0.055
-0.21%
1 ene 1989 año
26.044
-0.055
-0.21%
1 ene 1990 año
25.989
-0.055
-0.21%
1 ene 1991 año
25.617
-0.372
-1.43%
1 ene 1992 año
25.235
-0.383
-1.49%
1 ene 1993 año
24.863
-0.372
-1.47%
1 ene 1994 año
24.481
-0.383
-1.54%
1 ene 1995 año
24.044
-0.437
-1.79%
1 ene 1996 año
23.53
-0.514
-2.14%
1 ene 1997 año
21.858
-1.672
-7.11%
1 ene 1998 año
20.568
-1.29
-5.9%
1 ene 1999 año
20.765
+0.197
0.96%
1 ene 2000 año
18.743
-2.022
-9.74%
1 ene 2001 año
17.836
-0.907
-4.84%
1 ene 2002 año
17.475
-0.361
-2.02%
1 ene 2003 año
17.607
+0.131
0.75%
1 ene 2004 año
16.743
-0.863
-4.9%
1 ene 2005 año
16.798
+0.055
0.33%
1 ene 2006 año
13.972
-2.826
-16.82%
1 ene 2007 año
13.753
-0.219
-1.56%
1 ene 2008 año
12.553
-1.2
-8.72%
1 ene 2009 año
13.34
+0.787
6.27%
1 ene 2010 año
13.113
-0.227
-1.7%
1 ene 2011 año
12.529
-0.583
-4.45%
1 ene 2012 año
12.302
-0.227
-1.81%
1 ene 2013 año
12.27
-0.032
-0.26%
1 ene 2014 año
12.597
+0.327
2.66%
1 ene 2015 año
12.412
-0.185
-1.47%
Ranking de los países por los datos estadísticos actuales


Comentarios: