29
/es/
es
AIzaSyAYiBZKx7MnpbEhh9jyipgxe19OcubqV5w
April 1, 2024
27088
East Asia & Pacific
EAS
false
2
1
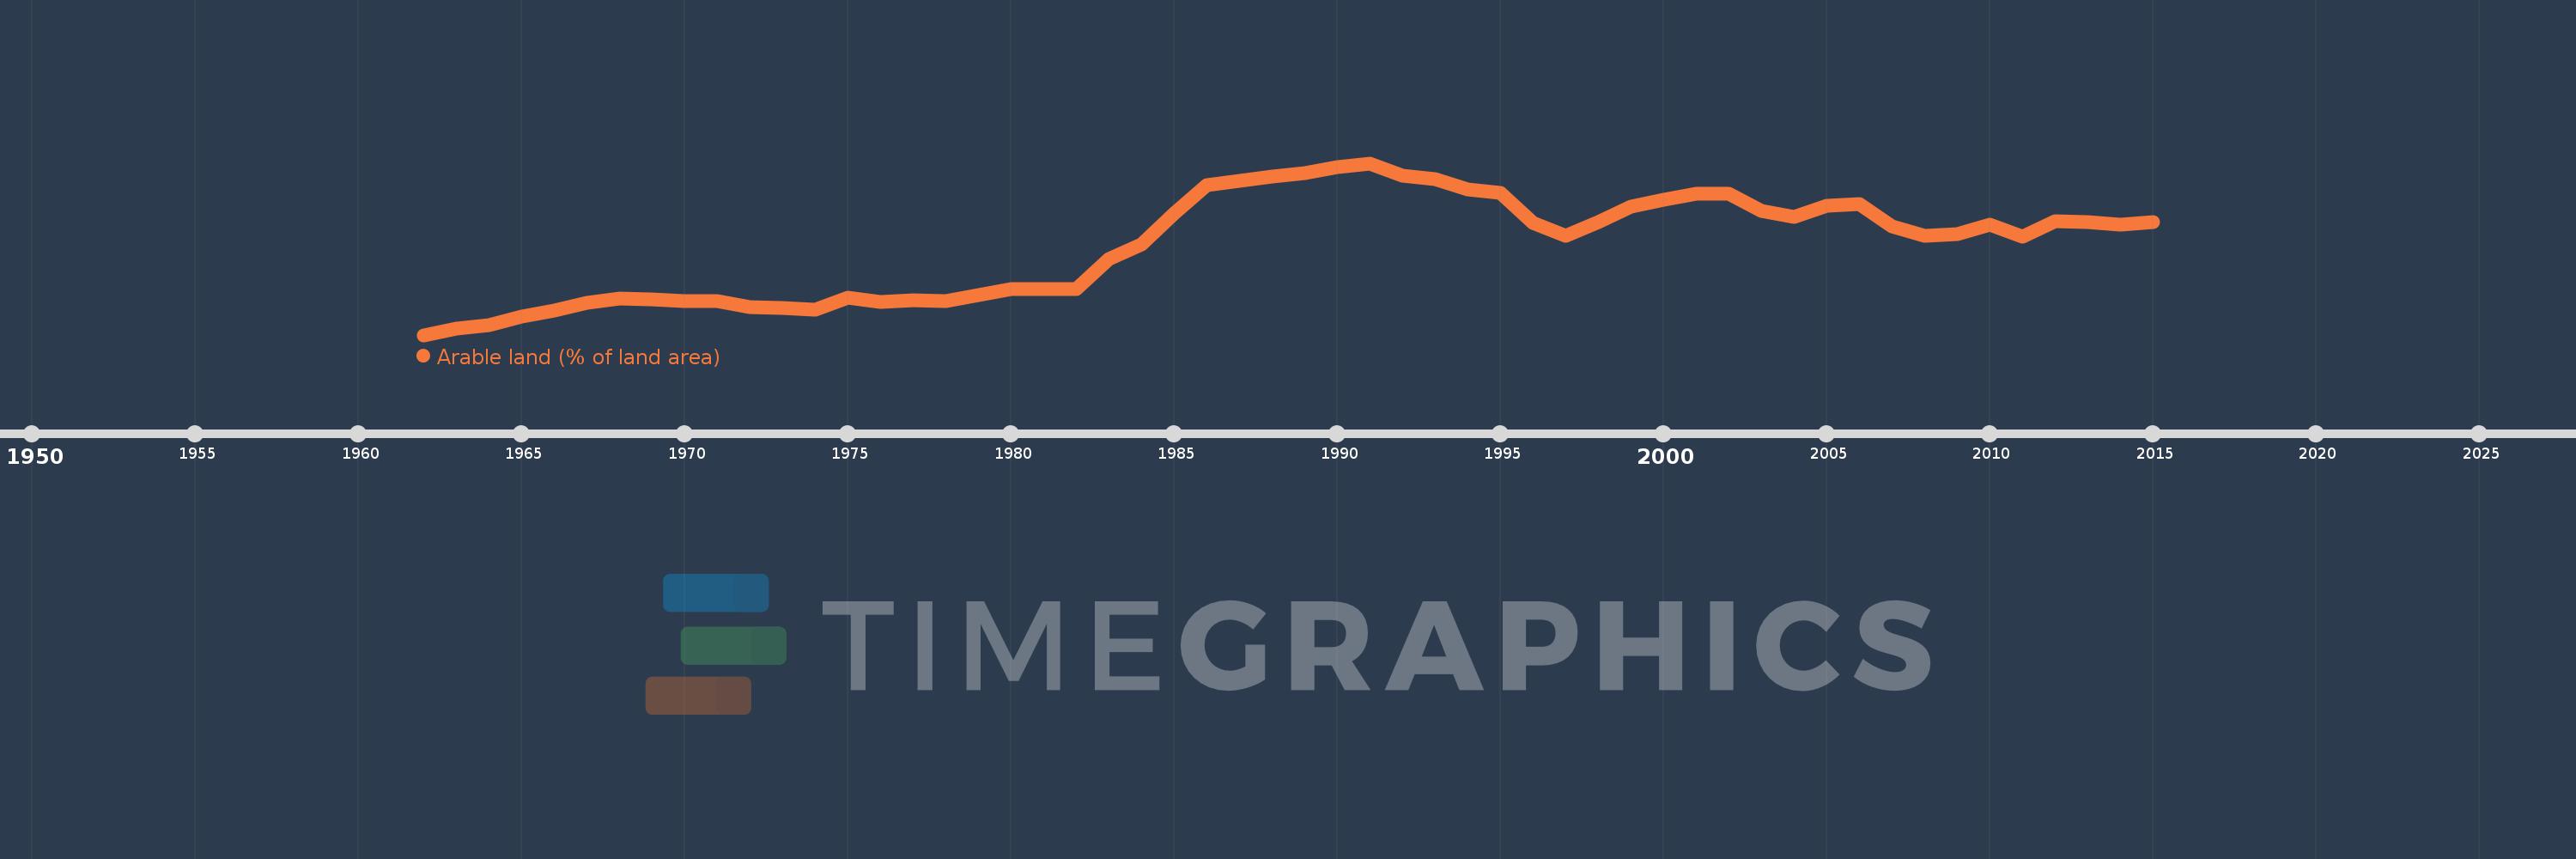
Arable land (% of land area)
2015,2014,2013,2012,2011,2010,2009,2008,2007,2006,2005,2004,2003,2002,2001,2000,1999,1998,1997,1996,1995,1994,1993,1992,1991,1990,1989,1988,1987,1986,1985,1984,1983,1982,1981,1980,1979,1978,1977,1976,1975,1974,1973,1972,1971,1970,1969,1968,1967,1966,1965,1964,1963,1962
Estas estadísticas en otros países:
AfghanistanAlbaniaAlgeriaAmerican SamoaAndorraAngolaAntigua and BarbudaArab WorldArgentinaArmeniaArubaAustraliaAustriaAzerbaijanBahamas, TheBahrainBangladeshBarbadosBelarusBelgiumBelizeBeninBermudaBhutanBoliviaBosnia and HerzegovinaBotswanaBrazilBritish Virgin IslandsBrunei DarussalamBulgariaBurkina FasoBurundiCabo VerdeCambodiaCameroonCanadaCaribbean small statesCayman IslandsCentral African RepublicCentral Europe and the BalticsChadChannel IslandsChileChinaColombiaComorosCongo, Dem. Rep.Congo, Rep.Costa RicaCote d'IvoireCroatiaCubaCyprusCzech RepublicDenmarkDjiboutiDominicaDominican RepublicEarly-demographic dividendEast Asia & PacificEast Asia & Pacific (excluding high income)East Asia & Pacific (IDA & IBRD countries)EcuadorEgypt, Arab Rep.El SalvadorEquatorial GuineaEritreaEstoniaEthiopiaEuro areaEurope & Central AsiaEurope & Central Asia (excluding high income)Europe & Central Asia (IDA & IBRD countries)European UnionFaroe IslandsFijiFinlandFragile and conflict affected situationsFranceFrench PolynesiaGabonGambia, TheGeorgiaGermanyGhanaGreeceGreenlandGrenadaGuamGuatemalaGuineaGuinea-BissauGuyanaHaitiHeavily indebted poor countries (HIPC)High incomeHondurasHong Kong SAR, ChinaHungaryIBRD onlyIcelandIDA & IBRD totalIDA blendIDA onlyIDA totalIndiaIndonesiaIran, Islamic Rep.IraqIrelandIsle of ManIsraelItalyJamaicaJapanJordanKazakhstanKenyaKiribatiKorea, Dem. People’s Rep.Korea, Rep.KosovoKuwaitKyrgyz RepublicLao PDRLate-demographic dividendLatin America & Caribbean Latin America & Caribbean (excluding high income)Latin America & the Caribbean (IDA & IBRD countries)LatviaLeast developed countries: UN classificationLebanonLesothoLiberiaLibyaLiechtensteinLithuaniaLow & middle incomeLow incomeLower middle incomeLuxembourgMacedonia, FYRMadagascarMalawiMalaysiaMaldivesMaliMaltaMarshall IslandsMauritaniaMauritiusMexicoMicronesia, Fed. Sts.Middle East & North AfricaMiddle East & North Africa (excluding high income)Middle East & North Africa (IDA & IBRD countries)Middle incomeMoldovaMongoliaMontenegroMoroccoMozambiqueMyanmarNamibiaNepalNetherlandsNew CaledoniaNew ZealandNicaraguaNigerNigeriaNorth AmericaNorthern Mariana IslandsNorwayOECD membersOmanOther small statesPacific island small statesPakistanPalauPanamaPapua New GuineaParaguayPeruPhilippinesPolandPortugalPost-demographic dividendPre-demographic dividendPuerto RicoQatarRomaniaRussian FederationRwandaSamoaSan MarinoSao Tome and PrincipeSaudi ArabiaSenegalSerbiaSeychellesSierra LeoneSingaporeSlovak RepublicSloveniaSmall statesSolomon IslandsSomaliaSouth AfricaSouth AsiaSouth Asia (IDA & IBRD)SpainSri LankaSt. Kitts and NevisSt. LuciaSt. Vincent and the GrenadinesSub-Saharan Africa Sub-Saharan Africa (excluding high income)Sub-Saharan Africa (IDA & IBRD countries)SudanSurinameSwazilandSwedenSwitzerlandSyrian Arab RepublicTajikistanTanzaniaThailandTimor-LesteTogoTongaTrinidad and TobagoTunisiaTurkeyTurkmenistanTurks and Caicos IslandsUgandaUkraineUnited Arab EmiratesUnited KingdomUnited StatesUpper middle incomeUruguayUzbekistanVanuatuVenezuela, RBVietnamVirgin Islands (U.S.)West Bank and GazaWorldYemen, Rep.ZambiaZimbabwe línea de tiempo (timeline):
En esta escala de tiempo se presenta un gráfico de 1962 y 2015 de East Asia & Pacific. Los datos de 1961 están ausentes. El número de observaciones reales por fecha: 54.
Fuente (nombre):
Indicadores del desarrollo mundial
Fuente (organización):
Food and Agriculture Organization, electronic files and web site.
Categorías:
Agriculture & Rural Development, Climate Change, Environment
Se ha actualizado:
23 abr 2017 año
Los indicadores de los cambios de valor en los últimos años
Mínimo:
8.211
1 ene 1962 año
Máximo:
10.229
1 ene 1991 año
A la fecha de observación
Valor
Cambio absoluto
El cambio con respecto al valor anterior
1 ene 1962 año
8.211
+8.211
0.0%
1 ene 1963 año
8.287
+0.077
0.93%
1 ene 1964 año
8.325
+0.037
0.45%
1 ene 1965 año
8.429
+0.105
1.26%
1 ene 1966 año
8.494
+0.065
0.77%
1 ene 1967 año
8.593
+0.099
1.16%
1 ene 1968 año
8.644
+0.051
0.59%
1 ene 1969 año
8.632
-0.011
-0.13%
1 ene 1970 año
8.614
-0.019
-0.22%
1 ene 1971 año
8.613
-0.001
-0.01%
1 ene 1972 año
8.54
-0.072
-0.84%
1 ene 1973 año
8.532
-0.009
-0.1%
1 ene 1974 año
8.511
-0.021
-0.25%
1 ene 1975 año
8.645
+0.134
1.57%
1 ene 1976 año
8.601
-0.044
-0.51%
1 ene 1977 año
8.619
+0.018
0.21%
1 ene 1978 año
8.614
-0.005
-0.06%
1 ene 1979 año
8.681
+0.067
0.78%
1 ene 1980 año
8.748
+0.067
0.77%
1 ene 1981 año
8.752
+0.004
0.05%
1 ene 1982 año
8.747
-0.005
-0.06%
1 ene 1983 año
9.101
+0.354
4.04%
1 ene 1984 año
9.273
+0.173
1.9%
1 ene 1985 año
9.643
+0.37
3.98%
1 ene 1986 año
9.974
+0.331
3.43%
1 ene 1987 año
10.021
+0.047
0.47%
1 ene 1988 año
10.076
+0.055
0.55%
1 ene 1989 año
10.11
+0.034
0.34%
1 ene 1990 año
10.181
+0.07
0.7%
1 ene 1991 año
10.229
+0.049
0.48%
1 ene 1992 año
10.082
-0.147
-1.44%
1 ene 1993 año
10.041
-0.042
-0.41%
1 ene 1994 año
9.925
-0.115
-1.15%
1 ene 1995 año
9.877
-0.048
-0.49%
1 ene 1996 año
9.53
-0.347
-3.51%
1 ene 1997 año
9.374
-0.156
-1.64%
1 ene 1998 año
9.535
+0.161
1.72%
1 ene 1999 año
9.72
+0.185
1.94%
1 ene 2000 año
9.801
+0.081
0.83%
1 ene 2001 año
9.871
+0.07
0.71%
1 ene 2002 año
9.874
+0.003
0.03%
1 ene 2003 año
9.664
-0.21
-2.13%
1 ene 2004 año
9.601
-0.063
-0.65%
1 ene 2005 año
9.725
+0.124
1.29%
1 ene 2006 año
9.75
+0.026
0.26%
1 ene 2007 año
9.492
-0.259
-2.65%
1 ene 2008 año
9.372
-0.12
-1.26%
1 ene 2009 año
9.401
+0.029
0.31%
1 ene 2010 año
9.507
+0.106
1.13%
1 ene 2011 año
9.367
-0.14
-1.47%
1 ene 2012 año
9.546
+0.179
1.91%
1 ene 2013 año
9.539
-0.007
-0.08%
1 ene 2014 año
9.504
-0.034
-0.36%
1 ene 2015 año
9.536
+0.031
0.33%
Ranking de los países por los datos estadísticos actuales


Comentarios: