29
/es/
es
AIzaSyAYiBZKx7MnpbEhh9jyipgxe19OcubqV5w
April 1, 2024
189887
Mali
MLI
true
2
1
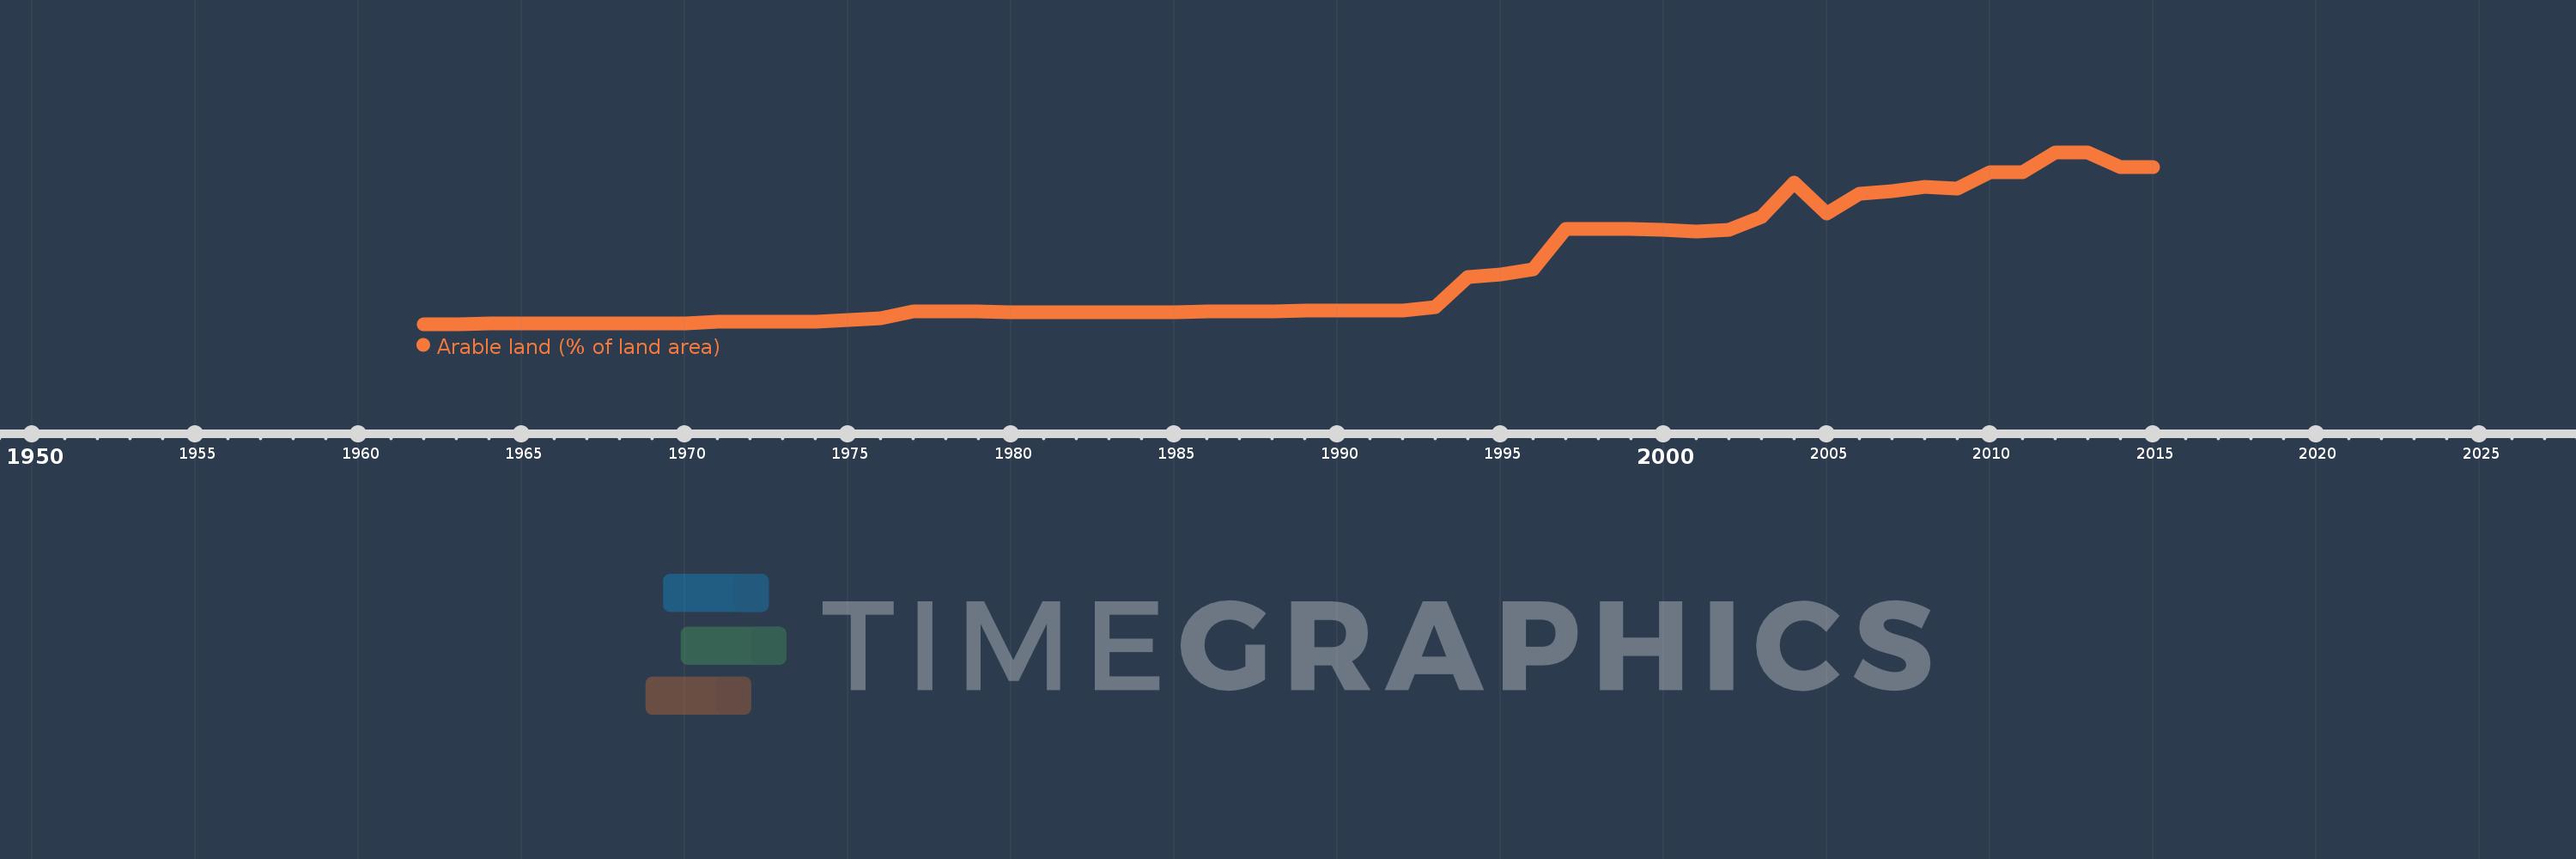
Arable land (% of land area)
2015,2014,2013,2012,2011,2010,2009,2008,2007,2006,2005,2004,2003,2002,2001,2000,1999,1998,1997,1996,1995,1994,1993,1992,1991,1990,1989,1988,1987,1986,1985,1984,1983,1982,1981,1980,1979,1978,1977,1976,1975,1974,1973,1972,1971,1970,1969,1968,1967,1966,1965,1964,1963,1962
Estas estadísticas en otros países:
AfghanistanAlbaniaAlgeriaAmerican SamoaAndorraAngolaAntigua and BarbudaArab WorldArgentinaArmeniaArubaAustraliaAustriaAzerbaijanBahamas, TheBahrainBangladeshBarbadosBelarusBelgiumBelizeBeninBermudaBhutanBoliviaBosnia and HerzegovinaBotswanaBrazilBritish Virgin IslandsBrunei DarussalamBulgariaBurkina FasoBurundiCabo VerdeCambodiaCameroonCanadaCaribbean small statesCayman IslandsCentral African RepublicCentral Europe and the BalticsChadChannel IslandsChileChinaColombiaComorosCongo, Dem. Rep.Congo, Rep.Costa RicaCote d'IvoireCroatiaCubaCyprusCzech RepublicDenmarkDjiboutiDominicaDominican RepublicEarly-demographic dividendEast Asia & PacificEast Asia & Pacific (excluding high income)East Asia & Pacific (IDA & IBRD countries)EcuadorEgypt, Arab Rep.El SalvadorEquatorial GuineaEritreaEstoniaEthiopiaEuro areaEurope & Central AsiaEurope & Central Asia (excluding high income)Europe & Central Asia (IDA & IBRD countries)European UnionFaroe IslandsFijiFinlandFragile and conflict affected situationsFranceFrench PolynesiaGabonGambia, TheGeorgiaGermanyGhanaGreeceGreenlandGrenadaGuamGuatemalaGuineaGuinea-BissauGuyanaHaitiHeavily indebted poor countries (HIPC)High incomeHondurasHong Kong SAR, ChinaHungaryIBRD onlyIcelandIDA & IBRD totalIDA blendIDA onlyIDA totalIndiaIndonesiaIran, Islamic Rep.IraqIrelandIsle of ManIsraelItalyJamaicaJapanJordanKazakhstanKenyaKiribatiKorea, Dem. People’s Rep.Korea, Rep.KosovoKuwaitKyrgyz RepublicLao PDRLate-demographic dividendLatin America & Caribbean Latin America & Caribbean (excluding high income)Latin America & the Caribbean (IDA & IBRD countries)LatviaLeast developed countries: UN classificationLebanonLesothoLiberiaLibyaLiechtensteinLithuaniaLow & middle incomeLow incomeLower middle incomeLuxembourgMacedonia, FYRMadagascarMalawiMalaysiaMaldivesMaliMaltaMarshall IslandsMauritaniaMauritiusMexicoMicronesia, Fed. Sts.Middle East & North AfricaMiddle East & North Africa (excluding high income)Middle East & North Africa (IDA & IBRD countries)Middle incomeMoldovaMongoliaMontenegroMoroccoMozambiqueMyanmarNamibiaNepalNetherlandsNew CaledoniaNew ZealandNicaraguaNigerNigeriaNorth AmericaNorthern Mariana IslandsNorwayOECD membersOmanOther small statesPacific island small statesPakistanPalauPanamaPapua New GuineaParaguayPeruPhilippinesPolandPortugalPost-demographic dividendPre-demographic dividendPuerto RicoQatarRomaniaRussian FederationRwandaSamoaSan MarinoSao Tome and PrincipeSaudi ArabiaSenegalSerbiaSeychellesSierra LeoneSingaporeSlovak RepublicSloveniaSmall statesSolomon IslandsSomaliaSouth AfricaSouth AsiaSouth Asia (IDA & IBRD)SpainSri LankaSt. Kitts and NevisSt. LuciaSt. Vincent and the GrenadinesSub-Saharan Africa Sub-Saharan Africa (excluding high income)Sub-Saharan Africa (IDA & IBRD countries)SudanSurinameSwazilandSwedenSwitzerlandSyrian Arab RepublicTajikistanTanzaniaThailandTimor-LesteTogoTongaTrinidad and TobagoTunisiaTurkeyTurkmenistanTurks and Caicos IslandsUgandaUkraineUnited Arab EmiratesUnited KingdomUnited StatesUpper middle incomeUruguayUzbekistanVanuatuVenezuela, RBVietnamVirgin Islands (U.S.)West Bank and GazaWorldYemen, Rep.ZambiaZimbabwe línea de tiempo (timeline):
En esta escala de tiempo se presenta un gráfico de 1962 y 2015 de Mali. Los datos de 1961 están ausentes. El número de observaciones reales por fecha: 54.
Fuente (nombre):
Indicadores del desarrollo mundial
Fuente (organización):
Food and Agriculture Organization, electronic files and web site.
Categorías:
Agriculture & Rural Development, Climate Change, Environment
Se ha actualizado:
23 abr 2017 año
Los indicadores de los cambios de valor en los últimos años
Mínimo:
1.342
1 ene 1962 año
Máximo:
5.623
1 ene 2012 año
A la fecha de observación
Valor
Cambio absoluto
El cambio con respecto al valor anterior
1 ene 1962 año
1.342
+1.342
0.0%
1 ene 1963 año
1.347
+0.004
0.31%
1 ene 1964 año
1.351
+0.004
0.3%
1 ene 1965 año
1.355
+0.004
0.3%
1 ene 1966 año
1.359
+0.004
0.3%
1 ene 1967 año
1.362
+0.003
0.24%
1 ene 1968 año
1.367
+0.005
0.36%
1 ene 1969 año
1.367
0.0
0.0%
1 ene 1970 año
1.367
0.0
0.0%
1 ene 1971 año
1.408
+0.041
3.0%
1 ene 1972 año
1.408
0.0
0.0%
1 ene 1973 año
1.408
0.0
0.0%
1 ene 1974 año
1.408
0.0
0.0%
1 ene 1975 año
1.449
+0.041
2.91%
1 ene 1976 año
1.49
+0.041
2.83%
1 ene 1977 año
1.653
+0.163
10.95%
1 ene 1978 año
1.651
-0.002
-0.1%
1 ene 1979 año
1.651
0.0
0.0%
1 ene 1980 año
1.647
-0.004
-0.25%
1 ene 1981 año
1.647
0.0
0.0%
1 ene 1982 año
1.65
+0.002
0.15%
1 ene 1983 año
1.65
0.0
0.0%
1 ene 1984 año
1.65
0.0
0.0%
1 ene 1985 año
1.65
0.0
0.0%
1 ene 1986 año
1.666
+0.016
0.99%
1 ene 1987 año
1.669
+0.002
0.15%
1 ene 1988 año
1.669
0.0
0.0%
1 ene 1989 año
1.683
+0.014
0.83%
1 ene 1990 año
1.683
0.0
0.0%
1 ene 1991 año
1.683
0.0
0.0%
1 ene 1992 año
1.691
+0.008
0.49%
1 ene 1993 año
1.773
+0.082
4.85%
1 ene 1994 año
2.508
+0.735
41.47%
1 ene 1995 año
2.59
+0.082
3.27%
1 ene 1996 año
2.72
+0.13
5.03%
1 ene 1997 año
3.721
+1.001
36.79%
1 ene 1998 año
3.717
-0.004
-0.11%
1 ene 1999 año
3.713
-0.004
-0.11%
1 ene 2000 año
3.704
-0.008
-0.22%
1 ene 2001 año
3.662
-0.043
-1.15%
1 ene 2002 año
3.688
+0.026
0.72%
1 ene 2003 año
4.016
+0.328
8.89%
1 ene 2004 año
4.87
+0.854
21.27%
1 ene 2005 año
4.099
-0.77
-15.82%
1 ene 2006 año
4.592
+0.493
12.02%
1 ene 2007 año
4.653
+0.061
1.32%
1 ene 2008 año
4.76
+0.107
2.31%
1 ene 2009 año
4.721
-0.039
-0.81%
1 ene 2010 año
5.127
+0.405
8.58%
1 ene 2011 año
5.131
+0.005
0.09%
1 ene 2012 año
5.623
+0.492
9.58%
1 ene 2013 año
5.623
0.0
0.0%
1 ene 2014 año
5.254
-0.369
-6.56%
1 ene 2015 año
5.254
0.0
0.0%
Ranking de los países por los datos estadísticos actuales


Comentarios: