29
/es/
es
AIzaSyAYiBZKx7MnpbEhh9jyipgxe19OcubqV5w
April 1, 2024
43213
Latin America & the Caribbean (IDA & IBRD countries)
TLA
false
2
1
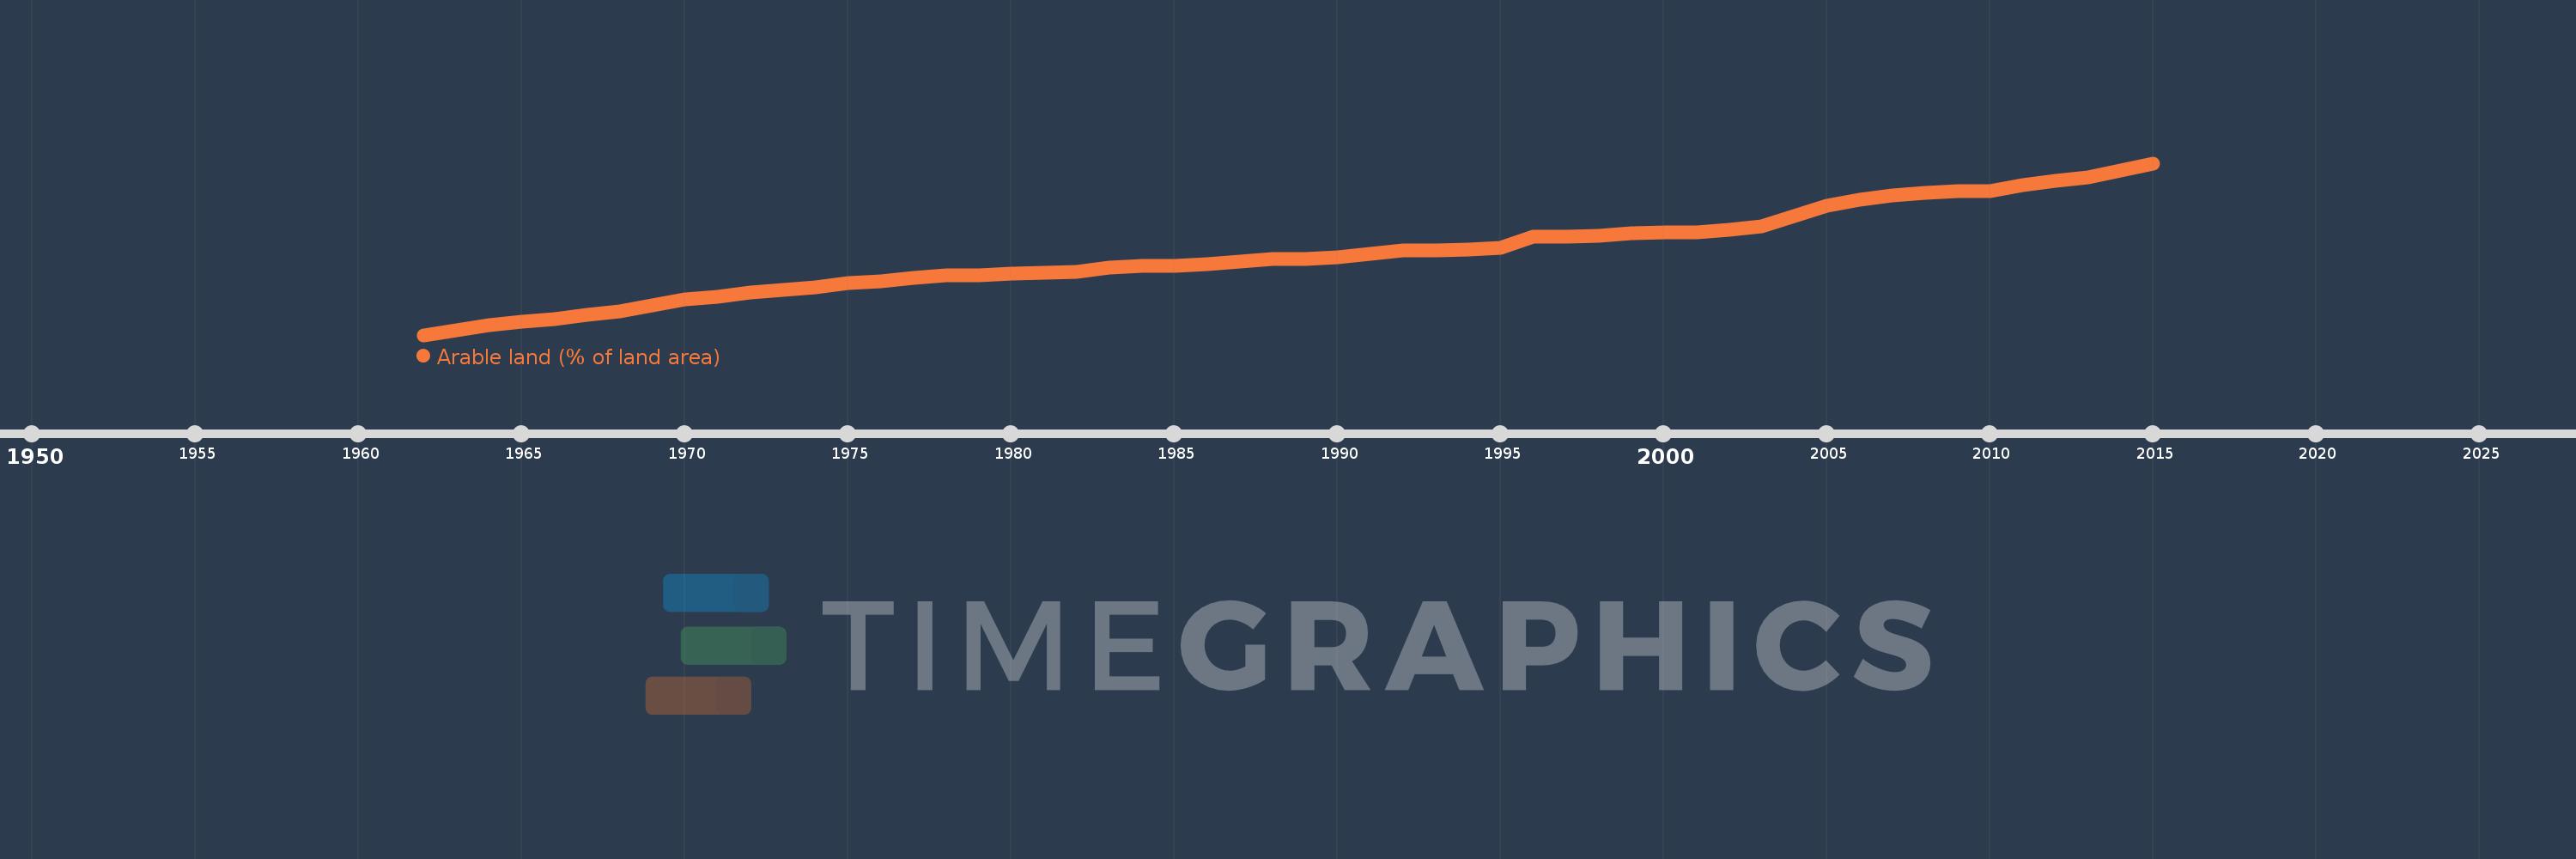
Arable land (% of land area)
2015,2014,2013,2012,2011,2010,2009,2008,2007,2006,2005,2004,2003,2002,2001,2000,1999,1998,1997,1996,1995,1994,1993,1992,1991,1990,1989,1988,1987,1986,1985,1984,1983,1982,1981,1980,1979,1978,1977,1976,1975,1974,1973,1972,1971,1970,1969,1968,1967,1966,1965,1964,1963,1962
Estas estadísticas en otros países:
AfghanistanAlbaniaAlgeriaAmerican SamoaAndorraAngolaAntigua and BarbudaArab WorldArgentinaArmeniaArubaAustraliaAustriaAzerbaijanBahamas, TheBahrainBangladeshBarbadosBelarusBelgiumBelizeBeninBermudaBhutanBoliviaBosnia and HerzegovinaBotswanaBrazilBritish Virgin IslandsBrunei DarussalamBulgariaBurkina FasoBurundiCabo VerdeCambodiaCameroonCanadaCaribbean small statesCayman IslandsCentral African RepublicCentral Europe and the BalticsChadChannel IslandsChileChinaColombiaComorosCongo, Dem. Rep.Congo, Rep.Costa RicaCote d'IvoireCroatiaCubaCyprusCzech RepublicDenmarkDjiboutiDominicaDominican RepublicEarly-demographic dividendEast Asia & PacificEast Asia & Pacific (excluding high income)East Asia & Pacific (IDA & IBRD countries)EcuadorEgypt, Arab Rep.El SalvadorEquatorial GuineaEritreaEstoniaEthiopiaEuro areaEurope & Central AsiaEurope & Central Asia (excluding high income)Europe & Central Asia (IDA & IBRD countries)European UnionFaroe IslandsFijiFinlandFragile and conflict affected situationsFranceFrench PolynesiaGabonGambia, TheGeorgiaGermanyGhanaGreeceGreenlandGrenadaGuamGuatemalaGuineaGuinea-BissauGuyanaHaitiHeavily indebted poor countries (HIPC)High incomeHondurasHong Kong SAR, ChinaHungaryIBRD onlyIcelandIDA & IBRD totalIDA blendIDA onlyIDA totalIndiaIndonesiaIran, Islamic Rep.IraqIrelandIsle of ManIsraelItalyJamaicaJapanJordanKazakhstanKenyaKiribatiKorea, Dem. People’s Rep.Korea, Rep.KosovoKuwaitKyrgyz RepublicLao PDRLate-demographic dividendLatin America & Caribbean Latin America & Caribbean (excluding high income)Latin America & the Caribbean (IDA & IBRD countries)LatviaLeast developed countries: UN classificationLebanonLesothoLiberiaLibyaLiechtensteinLithuaniaLow & middle incomeLow incomeLower middle incomeLuxembourgMacedonia, FYRMadagascarMalawiMalaysiaMaldivesMaliMaltaMarshall IslandsMauritaniaMauritiusMexicoMicronesia, Fed. Sts.Middle East & North AfricaMiddle East & North Africa (excluding high income)Middle East & North Africa (IDA & IBRD countries)Middle incomeMoldovaMongoliaMontenegroMoroccoMozambiqueMyanmarNamibiaNepalNetherlandsNew CaledoniaNew ZealandNicaraguaNigerNigeriaNorth AmericaNorthern Mariana IslandsNorwayOECD membersOmanOther small statesPacific island small statesPakistanPalauPanamaPapua New GuineaParaguayPeruPhilippinesPolandPortugalPost-demographic dividendPre-demographic dividendPuerto RicoQatarRomaniaRussian FederationRwandaSamoaSan MarinoSao Tome and PrincipeSaudi ArabiaSenegalSerbiaSeychellesSierra LeoneSingaporeSlovak RepublicSloveniaSmall statesSolomon IslandsSomaliaSouth AfricaSouth AsiaSouth Asia (IDA & IBRD)SpainSri LankaSt. Kitts and NevisSt. LuciaSt. Vincent and the GrenadinesSub-Saharan Africa Sub-Saharan Africa (excluding high income)Sub-Saharan Africa (IDA & IBRD countries)SudanSurinameSwazilandSwedenSwitzerlandSyrian Arab RepublicTajikistanTanzaniaThailandTimor-LesteTogoTongaTrinidad and TobagoTunisiaTurkeyTurkmenistanTurks and Caicos IslandsUgandaUkraineUnited Arab EmiratesUnited KingdomUnited StatesUpper middle incomeUruguayUzbekistanVanuatuVenezuela, RBVietnamVirgin Islands (U.S.)West Bank and GazaWorldYemen, Rep.ZambiaZimbabwe línea de tiempo (timeline):
En esta escala de tiempo se presenta un gráfico de 1962 y 2015 de Latin America & the Caribbean (IDA & IBRD countries). Los datos de 1961 están ausentes. El número de observaciones reales por fecha: 54.
Fuente (nombre):
Indicadores del desarrollo mundial
Fuente (organización):
Food and Agriculture Organization, electronic files and web site.
Categorías:
Agriculture & Rural Development, Climate Change, Environment
Se ha actualizado:
23 abr 2017 año
Los indicadores de los cambios de valor en los últimos años
Mínimo:
4.271
1 ene 1962 año
Máximo:
8.654
1 ene 2015 año
A la fecha de observación
Valor
Cambio absoluto
El cambio con respecto al valor anterior
1 ene 1962 año
4.271
+4.271
0.0%
1 ene 1963 año
4.393
+0.122
2.85%
1 ene 1964 año
4.525
+0.132
3.02%
1 ene 1965 año
4.605
+0.08
1.76%
1 ene 1966 año
4.68
+0.076
1.64%
1 ene 1967 año
4.782
+0.102
2.18%
1 ene 1968 año
4.866
+0.083
1.74%
1 ene 1969 año
5.038
+0.172
3.53%
1 ene 1970 año
5.188
+0.15
2.98%
1 ene 1971 año
5.244
+0.056
1.09%
1 ene 1972 año
5.349
+0.105
2.01%
1 ene 1973 año
5.413
+0.064
1.19%
1 ene 1974 año
5.477
+0.064
1.19%
1 ene 1975 año
5.589
+0.111
2.03%
1 ene 1976 año
5.649
+0.06
1.07%
1 ene 1977 año
5.718
+0.07
1.24%
1 ene 1978 año
5.787
+0.069
1.2%
1 ene 1979 año
5.794
+0.006
0.11%
1 ene 1980 año
5.833
+0.039
0.68%
1 ene 1981 año
5.849
+0.016
0.27%
1 ene 1982 año
5.877
+0.029
0.49%
1 ene 1983 año
6.002
+0.125
2.13%
1 ene 1984 año
6.026
+0.024
0.4%
1 ene 1985 año
6.034
+0.008
0.13%
1 ene 1986 año
6.075
+0.041
0.68%
1 ene 1987 año
6.155
+0.08
1.32%
1 ene 1988 año
6.203
+0.048
0.77%
1 ene 1989 año
6.214
+0.011
0.17%
1 ene 1990 año
6.253
+0.039
0.63%
1 ene 1991 año
6.332
+0.079
1.27%
1 ene 1992 año
6.431
+0.099
1.56%
1 ene 1993 año
6.42
-0.011
-0.18%
1 ene 1994 año
6.451
+0.031
0.49%
1 ene 1995 año
6.493
+0.042
0.66%
1 ene 1996 año
6.775
+0.281
4.33%
1 ene 1997 año
6.785
+0.01
0.15%
1 ene 1998 año
6.813
+0.029
0.42%
1 ene 1999 año
6.859
+0.046
0.67%
1 ene 2000 año
6.879
+0.02
0.29%
1 ene 2001 año
6.9
+0.021
0.31%
1 ene 2002 año
6.959
+0.059
0.85%
1 ene 2003 año
7.054
+0.095
1.36%
1 ene 2004 año
7.313
+0.259
3.68%
1 ene 2005 año
7.562
+0.249
3.41%
1 ene 2006 año
7.719
+0.157
2.07%
1 ene 2007 año
7.83
+0.112
1.45%
1 ene 2008 año
7.89
+0.06
0.76%
1 ene 2009 año
7.949
+0.059
0.75%
1 ene 2010 año
7.946
-0.004
-0.05%
1 ene 2011 año
8.093
+0.148
1.86%
1 ene 2012 año
8.213
+0.119
1.47%
1 ene 2013 año
8.284
+0.072
0.87%
1 ene 2014 año
8.478
+0.194
2.34%
1 ene 2015 año
8.654
+0.176
2.08%
Ranking de los países por los datos estadísticos actuales


Comentarios: