29
/es/
es
AIzaSyAYiBZKx7MnpbEhh9jyipgxe19OcubqV5w
April 1, 2024
48070
Middle East & North Africa
MEA
false
2
1
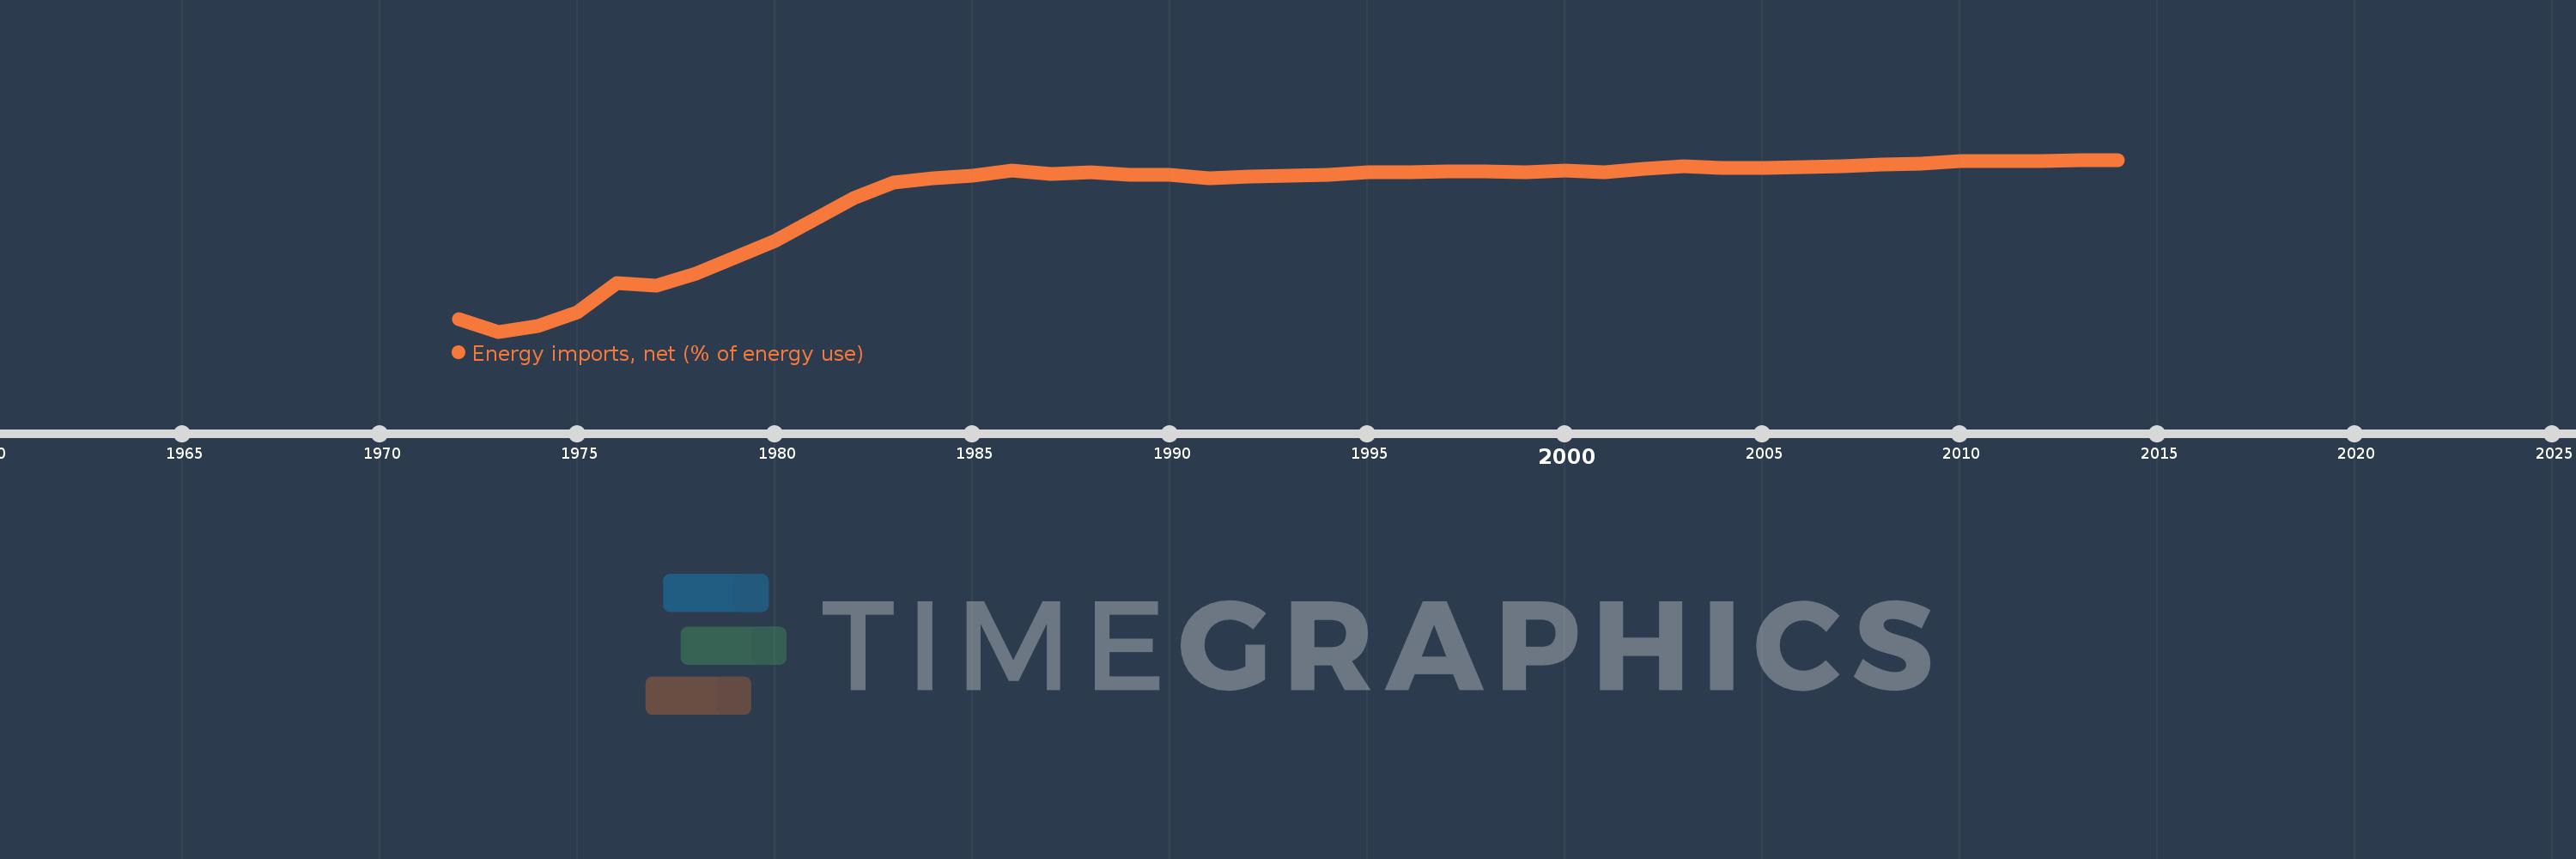
Energy imports, net (% of energy use)
2014,2013,2012,2011,2010,2009,2008,2007,2006,2005,2004,2003,2002,2001,2000,1999,1998,1997,1996,1995,1994,1993,1992,1991,1990,1989,1988,1987,1986,1985,1984,1983,1982,1981,1980,1979,1978,1977,1976,1975,1974,1973,1972
Estas estadísticas en otros países:
AlbaniaAlgeriaAngolaArab WorldArgentinaArmeniaAustraliaAustriaAzerbaijanBahrainBangladeshBelarusBelgiumBeninBoliviaBosnia and HerzegovinaBotswanaBrazilBrunei DarussalamBulgariaCambodiaCameroonCanadaCaribbean small statesCentral Europe and the BalticsChileChinaColombiaCongo, Dem. Rep.Congo, Rep.Costa RicaCote d'IvoireCroatiaCubaCuracaoCyprusCzech RepublicDenmarkDominican RepublicEarly-demographic dividendEast Asia & PacificEast Asia & Pacific (excluding high income)East Asia & Pacific (IDA & IBRD countries)EcuadorEgypt, Arab Rep.El SalvadorEritreaEstoniaEthiopiaEuro areaEurope & Central AsiaEurope & Central Asia (excluding high income)Europe & Central Asia (IDA & IBRD countries)European UnionFinlandFragile and conflict affected situationsFranceGabonGeorgiaGermanyGhanaGibraltarGreeceGuatemalaHaitiHeavily indebted poor countries (HIPC)High incomeHondurasHong Kong SAR, ChinaHungaryIBRD onlyIcelandIDA & IBRD totalIDA blendIDA onlyIDA totalIndiaIndonesiaIran, Islamic Rep.IraqIrelandIsraelItalyJamaicaJapanJordanKazakhstanKenyaKorea, Dem. People’s Rep.Korea, Rep.KosovoKuwaitKyrgyz RepublicLate-demographic dividendLatin America & Caribbean Latin America & Caribbean (excluding high income)Latin America & the Caribbean (IDA & IBRD countries)LatviaLeast developed countries: UN classificationLebanonLibyaLithuaniaLow & middle incomeLow incomeLower middle incomeLuxembourgMacedonia, FYRMalaysiaMaltaMauritiusMexicoMiddle East & North AfricaMiddle East & North Africa (excluding high income)Middle East & North Africa (IDA & IBRD countries)Middle incomeMoldovaMongoliaMontenegroMoroccoMozambiqueMyanmarNamibiaNepalNetherlandsNew ZealandNicaraguaNigerNigeriaNorth AmericaNorwayOECD membersOmanOther small statesPakistanPanamaParaguayPeruPhilippinesPolandPortugalPost-demographic dividendPre-demographic dividendQatarRomaniaRussian FederationSaudi ArabiaSenegalSerbiaSingaporeSlovak RepublicSloveniaSmall statesSouth AfricaSouth AsiaSouth Asia (IDA & IBRD)South SudanSpainSri LankaSub-Saharan Africa Sub-Saharan Africa (excluding high income)Sub-Saharan Africa (IDA & IBRD countries)SudanSwedenSwitzerlandSyrian Arab RepublicTajikistanTanzaniaThailandTogoTrinidad and TobagoTunisiaTurkeyTurkmenistanUkraineUnited Arab EmiratesUnited KingdomUnited StatesUpper middle incomeUruguayUzbekistanVenezuela, RBVietnamWorldYemen, Rep.ZambiaZimbabwe línea de tiempo (timeline):
En esta escala de tiempo se presenta un gráfico de 1972 y 2014 de Middle East & North Africa. Los datos de 1971 están ausentes. El número de observaciones reales por fecha: 43.
Fuente (nombre):
Indicadores del desarrollo mundial
Fuente (organización):
IEA Statistics © OECD/IEA 2014 (http://www.iea.org/stats/index.asp), subject to https://www.iea.org/t&c/termsandconditions/
Categorías:
Energy & Mining, Trade
Se ha actualizado:
23 abr 2017 año
Los indicadores de los cambios de valor en los últimos años
Mínimo:
-1.572 mil
1 ene 1973 año
Máximo:
-135.904
1 ene 2014 año
A la fecha de observación
Valor
Cambio absoluto
El cambio con respecto al valor anterior
1 ene 1972 año
-1.471 mil
-1.471 mil
0.0%
1 ene 1973 año
-1.572 mil
-100.885
6.86%
1 ene 1974 año
-1.524 mil
+48.274
-3.07%
1 ene 1975 año
-1.41 mil
+114.141
-7.49%
1 ene 1976 año
-1.165 mil
+245.06
-17.38%
1 ene 1977 año
-1.191 mil
-26.429
2.27%
1 ene 1978 año
-1.088 mil
+103.385
-8.68%
1 ene 1979 año
-951.923
+135.732
-12.48%
1 ene 1980 año
-814.259
+137.664
-14.46%
1 ene 1981 año
-633.84
+180.419
-22.16%
1 ene 1982 año
-458.247
+175.592
-27.7%
1 ene 1983 año
-322.672
+135.575
-29.59%
1 ene 1984 año
-287.316
+35.356
-10.96%
1 ene 1985 año
-269.661
+17.655
-6.14%
1 ene 1986 año
-228.389
+41.272
-15.31%
1 ene 1987 año
-253.479
-25.09
10.99%
1 ene 1988 año
-242.251
+11.228
-4.43%
1 ene 1989 año
-263.087
-20.836
8.6%
1 ene 1990 año
-263.819
-0.732
0.28%
1 ene 1991 año
-290.306
-26.487
10.04%
1 ene 1992 año
-273.997
+16.309
-5.62%
1 ene 1993 año
-268.486
+5.511
-2.01%
1 ene 1994 año
-261.079
+7.408
-2.76%
1 ene 1995 año
-241.456
+19.623
-7.52%
1 ene 1996 año
-237.556
+3.899
-1.61%
1 ene 1997 año
-232.939
+4.618
-1.94%
1 ene 1998 año
-230.689
+2.249
-0.97%
1 ene 1999 año
-241.202
-10.512
4.56%
1 ene 2000 año
-225.423
+15.778
-6.54%
1 ene 2001 año
-236.872
-11.449
5.08%
1 ene 2002 año
-212.44
+24.432
-10.31%
1 ene 2003 año
-189.827
+22.612
-10.64%
1 ene 2004 año
-204.897
-15.069
7.94%
1 ene 2005 año
-203.561
+1.336
-0.65%
1 ene 2006 año
-199.075
+4.486
-2.2%
1 ene 2007 año
-189.564
+9.511
-4.78%
1 ene 2008 año
-176.918
+12.645
-6.67%
1 ene 2009 año
-166.778
+10.141
-5.73%
1 ene 2010 año
-144.85
+21.927
-13.15%
1 ene 2011 año
-144.051
+0.799
-0.55%
1 ene 2012 año
-149.043
-4.991
3.47%
1 ene 2013 año
-141.109
+7.933
-5.32%
1 ene 2014 año
-135.904
+5.206
-3.69%
Ranking de los países por los datos estadísticos actuales


Comentarios: