29
/es/
es
AIzaSyAYiBZKx7MnpbEhh9jyipgxe19OcubqV5w
April 1, 2024
214237
Norway
NOR
true
2
1
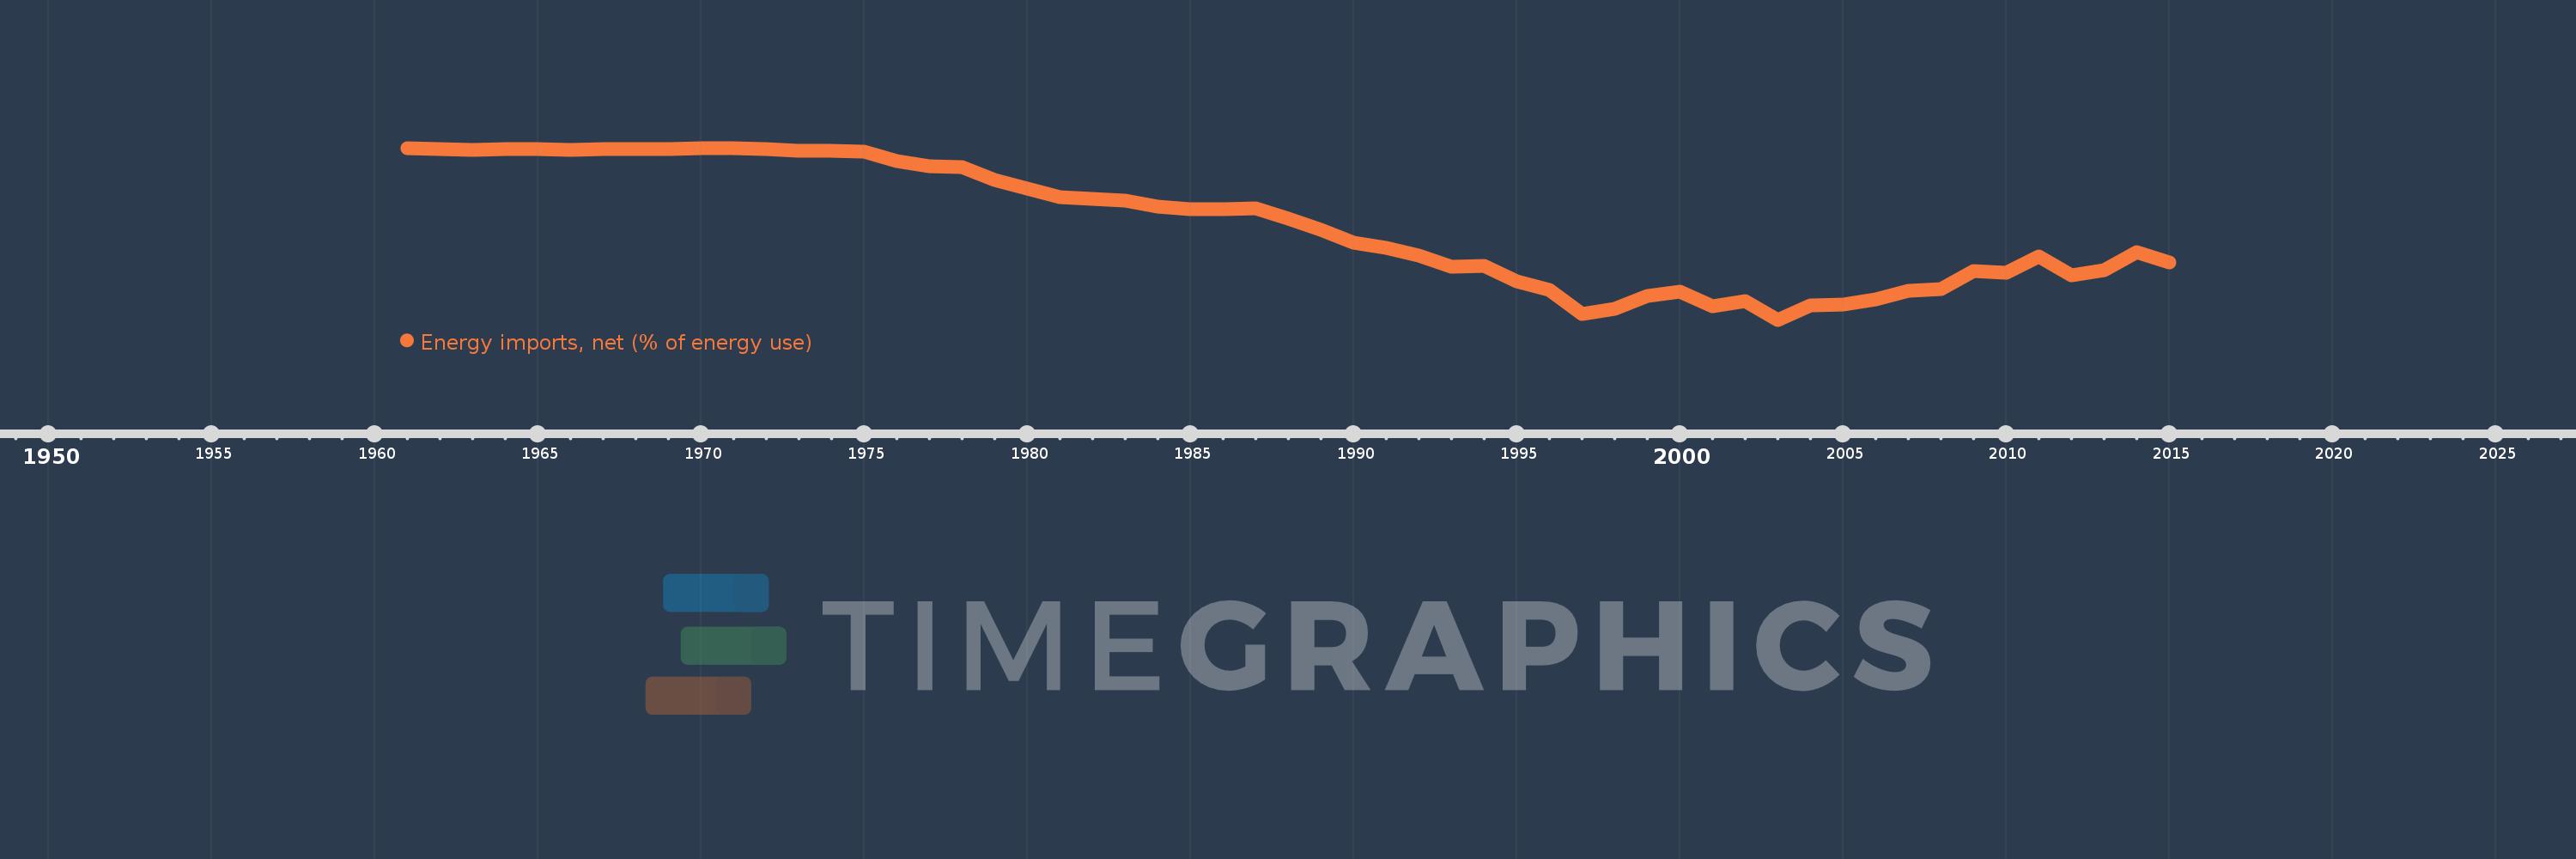
Energy imports, net (% of energy use)
2015,2014,2013,2012,2011,2010,2009,2008,2007,2006,2005,2004,2003,2002,2001,2000,1999,1998,1997,1996,1995,1994,1993,1992,1991,1990,1989,1988,1987,1986,1985,1984,1983,1982,1981,1980,1979,1978,1977,1976,1975,1974,1973,1972,1971,1970,1969,1968,1967,1966,1965,1964,1963,1962,1961
Estas estadísticas en otros países:
AlbaniaAlgeriaAngolaArab WorldArgentinaArmeniaAustraliaAustriaAzerbaijanBahrainBangladeshBelarusBelgiumBeninBoliviaBosnia and HerzegovinaBotswanaBrazilBrunei DarussalamBulgariaCambodiaCameroonCanadaCaribbean small statesCentral Europe and the BalticsChileChinaColombiaCongo, Dem. Rep.Congo, Rep.Costa RicaCote d'IvoireCroatiaCubaCuracaoCyprusCzech RepublicDenmarkDominican RepublicEarly-demographic dividendEast Asia & PacificEast Asia & Pacific (excluding high income)East Asia & Pacific (IDA & IBRD countries)EcuadorEgypt, Arab Rep.El SalvadorEritreaEstoniaEthiopiaEuro areaEurope & Central AsiaEurope & Central Asia (excluding high income)Europe & Central Asia (IDA & IBRD countries)European UnionFinlandFragile and conflict affected situationsFranceGabonGeorgiaGermanyGhanaGibraltarGreeceGuatemalaHaitiHeavily indebted poor countries (HIPC)High incomeHondurasHong Kong SAR, ChinaHungaryIBRD onlyIcelandIDA & IBRD totalIDA blendIDA onlyIDA totalIndiaIndonesiaIran, Islamic Rep.IraqIrelandIsraelItalyJamaicaJapanJordanKazakhstanKenyaKorea, Dem. People’s Rep.Korea, Rep.KosovoKuwaitKyrgyz RepublicLate-demographic dividendLatin America & Caribbean Latin America & Caribbean (excluding high income)Latin America & the Caribbean (IDA & IBRD countries)LatviaLeast developed countries: UN classificationLebanonLibyaLithuaniaLow & middle incomeLow incomeLower middle incomeLuxembourgMacedonia, FYRMalaysiaMaltaMauritiusMexicoMiddle East & North AfricaMiddle East & North Africa (excluding high income)Middle East & North Africa (IDA & IBRD countries)Middle incomeMoldovaMongoliaMontenegroMoroccoMozambiqueMyanmarNamibiaNepalNetherlandsNew ZealandNicaraguaNigerNigeriaNorth AmericaNorwayOECD membersOmanOther small statesPakistanPanamaParaguayPeruPhilippinesPolandPortugalPost-demographic dividendPre-demographic dividendQatarRomaniaRussian FederationSaudi ArabiaSenegalSerbiaSingaporeSlovak RepublicSloveniaSmall statesSouth AfricaSouth AsiaSouth Asia (IDA & IBRD)South SudanSpainSri LankaSub-Saharan Africa Sub-Saharan Africa (excluding high income)Sub-Saharan Africa (IDA & IBRD countries)SudanSwedenSwitzerlandSyrian Arab RepublicTajikistanTanzaniaThailandTogoTrinidad and TobagoTunisiaTurkeyTurkmenistanUkraineUnited Arab EmiratesUnited KingdomUnited StatesUpper middle incomeUruguayUzbekistanVenezuela, RBVietnamWorldYemen, Rep.ZambiaZimbabwe línea de tiempo (timeline):
En esta escala de tiempo se presenta un gráfico de 1961 y 2015 de Norway. Los datos de 1960 están ausentes. El número de observaciones reales por fecha: 55.
Fuente (nombre):
Indicadores del desarrollo mundial
Fuente (organización):
IEA Statistics © OECD/IEA 2014 (http://www.iea.org/stats/index.asp), subject to https://www.iea.org/t&c/termsandconditions/
Categorías:
Energy & Mining, Trade
Se ha actualizado:
23 abr 2017 año
Los indicadores de los cambios de valor en los últimos años
Mínimo:
-843.122
1 ene 2003 año
Máximo:
60.032
1 ene 1971 año
A la fecha de observación
Valor
Cambio absoluto
El cambio con respecto al valor anterior
1 ene 1961 año
56.542
+56.542
0.0%
1 ene 1962 año
54.917
-1.625
-2.87%
1 ene 1963 año
51.8
-3.117
-5.68%
1 ene 1964 año
53.94
+2.139
4.13%
1 ene 1965 año
51.937
-2.003
-3.71%
1 ene 1966 año
51.868
-0.069
-0.13%
1 ene 1967 año
55.963
+4.095
7.9%
1 ene 1968 año
54.178
-1.785
-3.19%
1 ene 1969 año
53.579
-0.599
-1.11%
1 ene 1970 año
57.655
+4.076
7.61%
1 ene 1971 año
60.032
+2.377
4.12%
1 ene 1972 año
54.745
-5.287
-8.81%
1 ene 1973 año
44.394
-10.351
-18.91%
1 ene 1974 año
43.571
-0.823
-1.85%
1 ene 1975 año
39.889
-3.681
-8.45%
1 ene 1976 año
-10.485
-50.374
-126.28%
1 ene 1977 año
-36.742
-26.257
250.43%
1 ene 1978 año
-42.098
-5.356
14.58%
1 ene 1979 año
-109.066
-66.968
159.08%
1 ene 1980 año
-152.883
-43.817
40.17%
1 ene 1981 año
-200.152
-47.27
30.92%
1 ene 1982 año
-206.64
-6.488
3.24%
1 ene 1983 año
-216.651
-10.011
4.84%
1 ene 1984 año
-248.251
-31.6
14.59%
1 ene 1985 año
-260.851
-12.601
5.08%
1 ene 1986 año
-263.919
-3.068
1.18%
1 ene 1987 año
-258.456
+5.463
-2.07%
1 ene 1988 año
-310.276
-51.82
20.05%
1 ene 1989 año
-369.271
-58.995
19.01%
1 ene 1990 año
-437.022
-67.751
18.35%
1 ene 1991 año
-467.107
-30.085
6.88%
1 ene 1992 año
-504.263
-37.156
7.95%
1 ene 1993 año
-565.311
-61.049
12.11%
1 ene 1994 año
-559.846
+5.465
-0.97%
1 ene 1995 año
-639.812
-79.966
14.28%
1 ene 1996 año
-687.089
-47.278
7.39%
1 ene 1997 año
-811.875
-124.785
18.16%
1 ene 1998 año
-784.037
+27.838
-3.43%
1 ene 1999 año
-719.755
+64.281
-8.2%
1 ene 2000 año
-696.53
+23.226
-3.23%
1 ene 2001 año
-771.484
-74.954
10.76%
1 ene 2002 año
-743.67
+27.813
-3.61%
1 ene 2003 año
-843.122
-99.452
13.37%
1 ene 2004 año
-768.053
+75.07
-8.9%
1 ene 2005 año
-764.303
+3.75
-0.49%
1 ene 2006 año
-736.084
+28.218
-3.69%
1 ene 2007 año
-692.685
+43.399
-5.9%
1 ene 2008 año
-680.164
+12.521
-1.81%
1 ene 2009 año
-588.496
+91.668
-13.48%
1 ene 2010 año
-593.9
-5.404
0.92%
1 ene 2011 año
-511.87
+82.031
-13.81%
1 ene 2012 año
-611.206
-99.337
19.41%
1 ene 2013 año
-584.02
+27.186
-4.45%
1 ene 2014 año
-485.887
+98.133
-16.8%
1 ene 2015 año
-543.709
-57.822
11.9%
Ranking de los países por los datos estadísticos actuales


Comentarios: