29
/es/
es
AIzaSyAYiBZKx7MnpbEhh9jyipgxe19OcubqV5w
April 1, 2024
257233
Switzerland
CHE
true
2
1
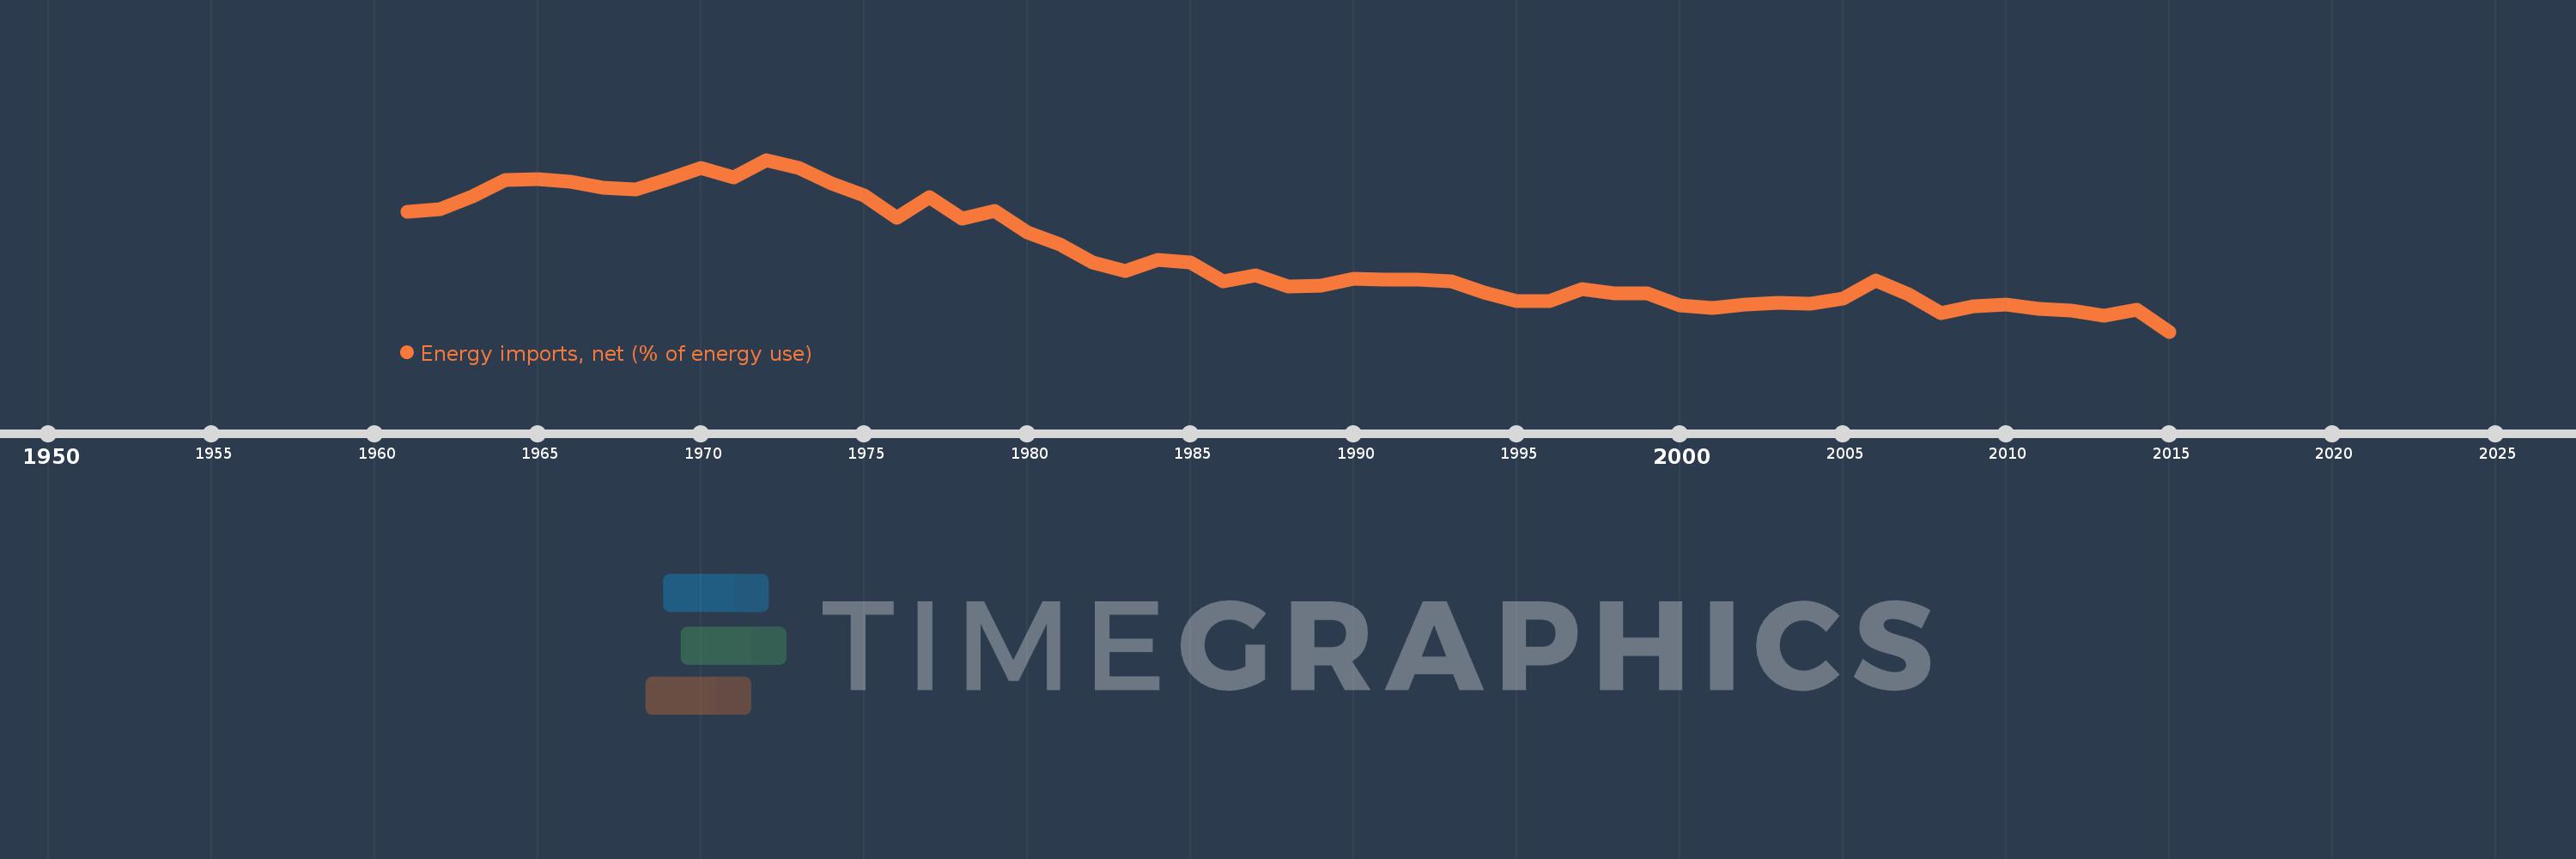
Energy imports, net (% of energy use)
2015,2014,2013,2012,2011,2010,2009,2008,2007,2006,2005,2004,2003,2002,2001,2000,1999,1998,1997,1996,1995,1994,1993,1992,1991,1990,1989,1988,1987,1986,1985,1984,1983,1982,1981,1980,1979,1978,1977,1976,1975,1974,1973,1972,1971,1970,1969,1968,1967,1966,1965,1964,1963,1962,1961
Estas estadísticas en otros países:
AlbaniaAlgeriaAngolaArab WorldArgentinaArmeniaAustraliaAustriaAzerbaijanBahrainBangladeshBelarusBelgiumBeninBoliviaBosnia and HerzegovinaBotswanaBrazilBrunei DarussalamBulgariaCambodiaCameroonCanadaCaribbean small statesCentral Europe and the BalticsChileChinaColombiaCongo, Dem. Rep.Congo, Rep.Costa RicaCote d'IvoireCroatiaCubaCuracaoCyprusCzech RepublicDenmarkDominican RepublicEarly-demographic dividendEast Asia & PacificEast Asia & Pacific (excluding high income)East Asia & Pacific (IDA & IBRD countries)EcuadorEgypt, Arab Rep.El SalvadorEritreaEstoniaEthiopiaEuro areaEurope & Central AsiaEurope & Central Asia (excluding high income)Europe & Central Asia (IDA & IBRD countries)European UnionFinlandFragile and conflict affected situationsFranceGabonGeorgiaGermanyGhanaGibraltarGreeceGuatemalaHaitiHeavily indebted poor countries (HIPC)High incomeHondurasHong Kong SAR, ChinaHungaryIBRD onlyIcelandIDA & IBRD totalIDA blendIDA onlyIDA totalIndiaIndonesiaIran, Islamic Rep.IraqIrelandIsraelItalyJamaicaJapanJordanKazakhstanKenyaKorea, Dem. People’s Rep.Korea, Rep.KosovoKuwaitKyrgyz RepublicLate-demographic dividendLatin America & Caribbean Latin America & Caribbean (excluding high income)Latin America & the Caribbean (IDA & IBRD countries)LatviaLeast developed countries: UN classificationLebanonLibyaLithuaniaLow & middle incomeLow incomeLower middle incomeLuxembourgMacedonia, FYRMalaysiaMaltaMauritiusMexicoMiddle East & North AfricaMiddle East & North Africa (excluding high income)Middle East & North Africa (IDA & IBRD countries)Middle incomeMoldovaMongoliaMontenegroMoroccoMozambiqueMyanmarNamibiaNepalNetherlandsNew ZealandNicaraguaNigerNigeriaNorth AmericaNorwayOECD membersOmanOther small statesPakistanPanamaParaguayPeruPhilippinesPolandPortugalPost-demographic dividendPre-demographic dividendQatarRomaniaRussian FederationSaudi ArabiaSenegalSerbiaSingaporeSlovak RepublicSloveniaSmall statesSouth AfricaSouth AsiaSouth Asia (IDA & IBRD)South SudanSpainSri LankaSub-Saharan Africa Sub-Saharan Africa (excluding high income)Sub-Saharan Africa (IDA & IBRD countries)SudanSwedenSwitzerlandSyrian Arab RepublicTajikistanTanzaniaThailandTogoTrinidad and TobagoTunisiaTurkeyTurkmenistanUkraineUnited Arab EmiratesUnited KingdomUnited StatesUpper middle incomeUruguayUzbekistanVenezuela, RBVietnamWorldYemen, Rep.ZambiaZimbabwe línea de tiempo (timeline):
En esta escala de tiempo se presenta un gráfico de 1961 y 2015 de Switzerland. Los datos de 1960 están ausentes. El número de observaciones reales por fecha: 55.
Fuente (nombre):
Indicadores del desarrollo mundial
Fuente (organización):
IEA Statistics © OECD/IEA 2014 (http://www.iea.org/stats/index.asp), subject to https://www.iea.org/t&c/termsandconditions/
Categorías:
Energy & Mining, Trade
Se ha actualizado:
23 abr 2017 año
Los indicadores de los cambios de valor en los últimos años
Mínimo:
47.016
1 ene 2015 año
Máximo:
82.277
1 ene 1972 año
A la fecha de observación
Valor
Cambio absoluto
El cambio con respecto al valor anterior
1 ene 1961 año
71.668
+71.668
0.0%
1 ene 1962 año
72.206
+0.538
0.75%
1 ene 1963 año
74.78
+2.574
3.56%
1 ene 1964 año
78.189
+3.41
4.56%
1 ene 1965 año
78.342
+0.153
0.2%
1 ene 1966 año
77.801
-0.541
-0.69%
1 ene 1967 año
76.554
-1.247
-1.6%
1 ene 1968 año
76.257
-0.297
-0.39%
1 ene 1969 año
78.396
+2.139
2.81%
1 ene 1970 año
80.643
+2.247
2.87%
1 ene 1971 año
78.738
-1.905
-2.36%
1 ene 1972 año
82.277
+3.539
4.49%
1 ene 1973 año
80.528
-1.749
-2.13%
1 ene 1974 año
77.364
-3.163
-3.93%
1 ene 1975 año
74.907
-2.458
-3.18%
1 ene 1976 año
70.314
-4.593
-6.13%
1 ene 1977 año
74.691
+4.377
6.22%
1 ene 1978 año
70.244
-4.447
-5.95%
1 ene 1979 año
71.728
+1.484
2.11%
1 ene 1980 año
67.379
-4.349
-6.06%
1 ene 1981 año
64.915
-2.464
-3.66%
1 ene 1982 año
61.136
-3.779
-5.82%
1 ene 1983 año
59.502
-1.634
-2.67%
1 ene 1984 año
61.726
+2.223
3.74%
1 ene 1985 año
61.196
-0.529
-0.86%
1 ene 1986 año
57.369
-3.828
-6.25%
1 ene 1987 año
58.59
+1.221
2.13%
1 ene 1988 año
56.291
-2.298
-3.92%
1 ene 1989 año
56.489
+0.198
0.35%
1 ene 1990 año
57.831
+1.342
2.38%
1 ene 1991 año
57.746
-0.085
-0.15%
1 ene 1992 año
57.693
-0.053
-0.09%
1 ene 1993 año
57.272
-0.421
-0.73%
1 ene 1994 año
54.987
-2.285
-3.99%
1 ene 1995 año
53.361
-1.626
-2.96%
1 ene 1996 año
53.31
-0.052
-0.1%
1 ene 1997 año
55.817
+2.507
4.7%
1 ene 1998 año
54.895
-0.922
-1.65%
1 ene 1999 año
54.882
-0.012
-0.02%
1 ene 2000 año
52.348
-2.534
-4.62%
1 ene 2001 año
51.933
-0.414
-0.79%
1 ene 2002 año
52.648
+0.715
1.38%
1 ene 2003 año
52.97
+0.322
0.61%
1 ene 2004 año
52.753
-0.217
-0.41%
1 ene 2005 año
53.733
+0.98
1.86%
1 ene 2006 año
57.573
+3.839
7.15%
1 ene 2007 año
54.692
-2.88
-5.0%
1 ene 2008 año
50.837
-3.856
-7.05%
1 ene 2009 año
52.166
+1.33
2.62%
1 ene 2010 año
52.59
+0.424
0.81%
1 ene 2011 año
51.776
-0.814
-1.55%
1 ene 2012 año
51.359
-0.417
-0.81%
1 ene 2013 año
50.279
-1.08
-2.1%
1 ene 2014 año
51.542
+1.263
2.51%
1 ene 2015 año
47.016
-4.526
-8.78%
Ranking de los países por los datos estadísticos actuales


Comentarios: