29
/es/
es
AIzaSyAYiBZKx7MnpbEhh9jyipgxe19OcubqV5w
April 1, 2024
124708
Egypt, Arab Rep.
EGY
true
2
1
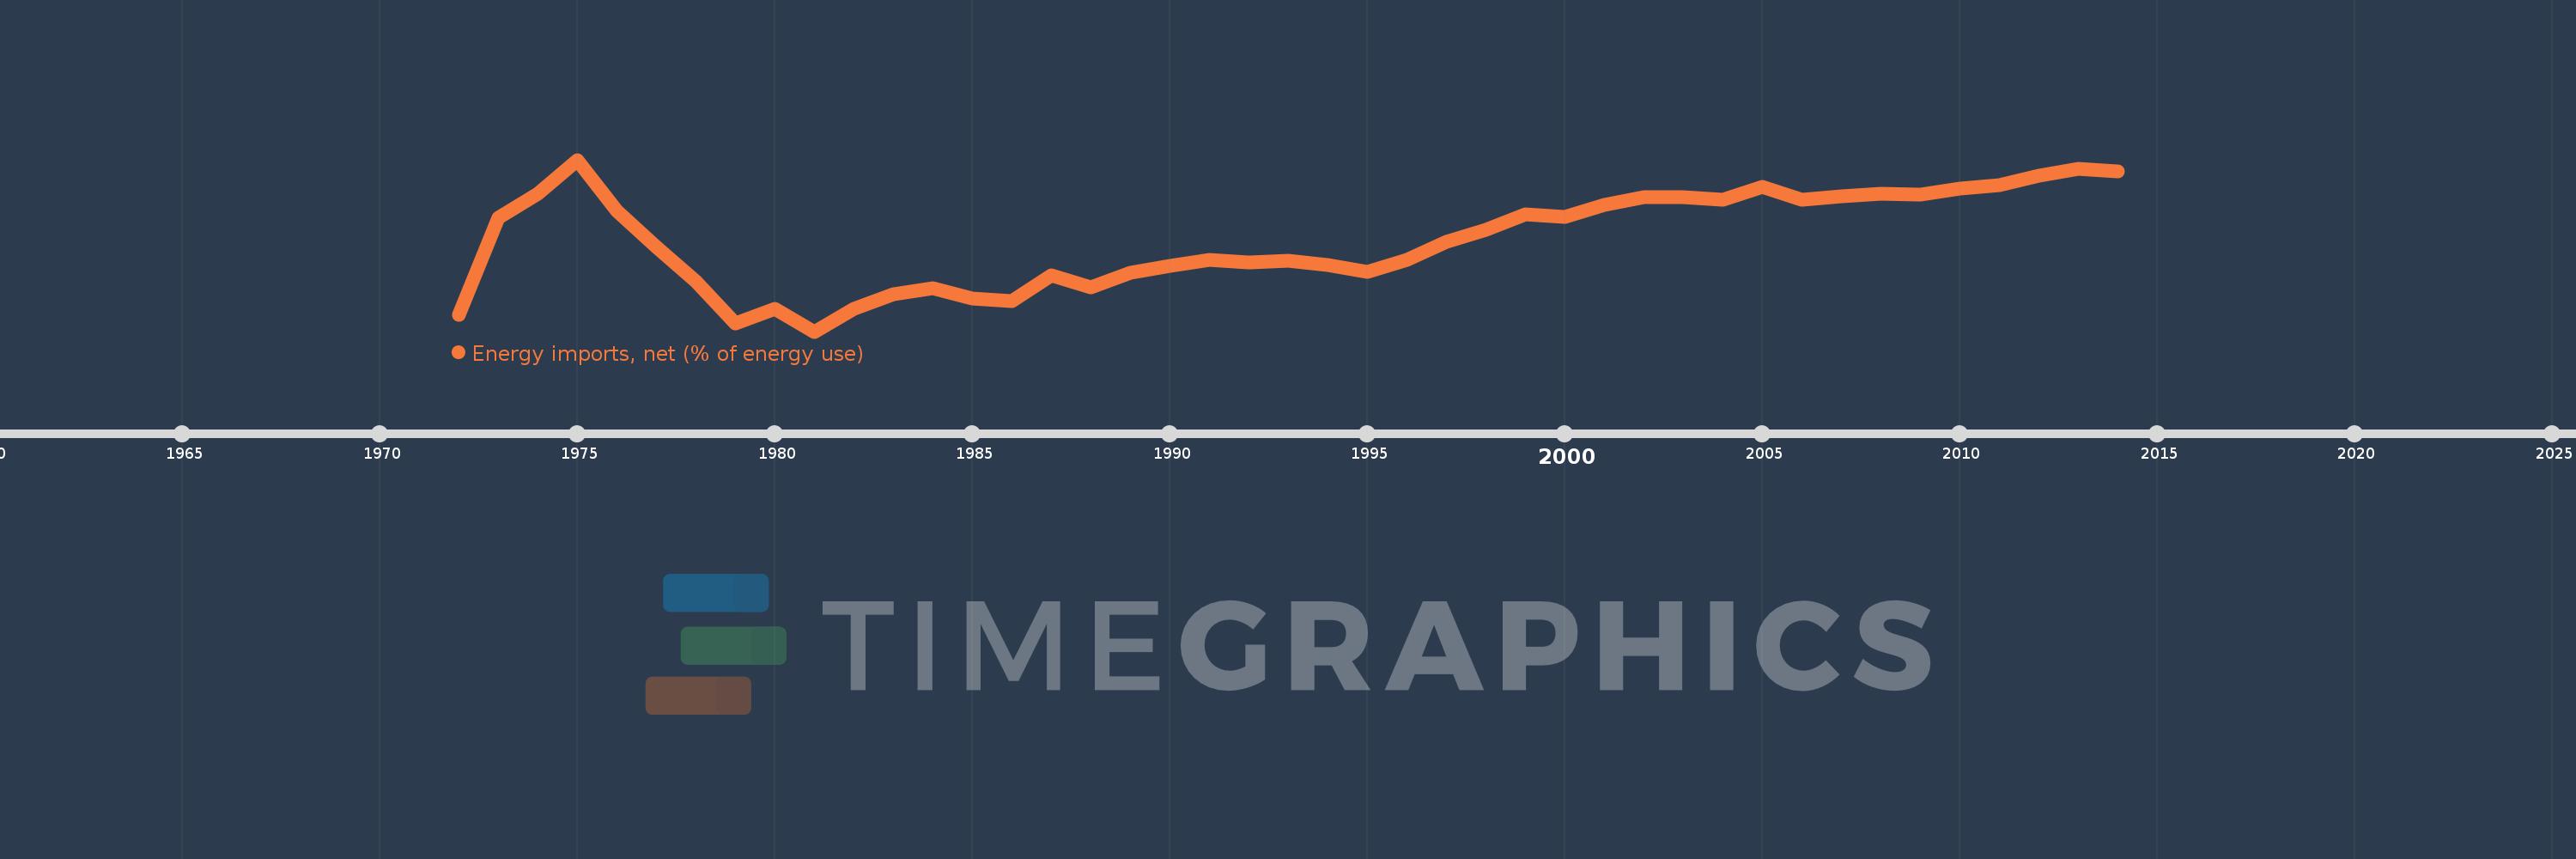
Energy imports, net (% of energy use)
2014,2013,2012,2011,2010,2009,2008,2007,2006,2005,2004,2003,2002,2001,2000,1999,1998,1997,1996,1995,1994,1993,1992,1991,1990,1989,1988,1987,1986,1985,1984,1983,1982,1981,1980,1979,1978,1977,1976,1975,1974,1973,1972
Estas estadísticas en otros países:
AlbaniaAlgeriaAngolaArab WorldArgentinaArmeniaAustraliaAustriaAzerbaijanBahrainBangladeshBelarusBelgiumBeninBoliviaBosnia and HerzegovinaBotswanaBrazilBrunei DarussalamBulgariaCambodiaCameroonCanadaCaribbean small statesCentral Europe and the BalticsChileChinaColombiaCongo, Dem. Rep.Congo, Rep.Costa RicaCote d'IvoireCroatiaCubaCuracaoCyprusCzech RepublicDenmarkDominican RepublicEarly-demographic dividendEast Asia & PacificEast Asia & Pacific (excluding high income)East Asia & Pacific (IDA & IBRD countries)EcuadorEgypt, Arab Rep.El SalvadorEritreaEstoniaEthiopiaEuro areaEurope & Central AsiaEurope & Central Asia (excluding high income)Europe & Central Asia (IDA & IBRD countries)European UnionFinlandFragile and conflict affected situationsFranceGabonGeorgiaGermanyGhanaGibraltarGreeceGuatemalaHaitiHeavily indebted poor countries (HIPC)High incomeHondurasHong Kong SAR, ChinaHungaryIBRD onlyIcelandIDA & IBRD totalIDA blendIDA onlyIDA totalIndiaIndonesiaIran, Islamic Rep.IraqIrelandIsraelItalyJamaicaJapanJordanKazakhstanKenyaKorea, Dem. People’s Rep.Korea, Rep.KosovoKuwaitKyrgyz RepublicLate-demographic dividendLatin America & Caribbean Latin America & Caribbean (excluding high income)Latin America & the Caribbean (IDA & IBRD countries)LatviaLeast developed countries: UN classificationLebanonLibyaLithuaniaLow & middle incomeLow incomeLower middle incomeLuxembourgMacedonia, FYRMalaysiaMaltaMauritiusMexicoMiddle East & North AfricaMiddle East & North Africa (excluding high income)Middle East & North Africa (IDA & IBRD countries)Middle incomeMoldovaMongoliaMontenegroMoroccoMozambiqueMyanmarNamibiaNepalNetherlandsNew ZealandNicaraguaNigerNigeriaNorth AmericaNorwayOECD membersOmanOther small statesPakistanPanamaParaguayPeruPhilippinesPolandPortugalPost-demographic dividendPre-demographic dividendQatarRomaniaRussian FederationSaudi ArabiaSenegalSerbiaSingaporeSlovak RepublicSloveniaSmall statesSouth AfricaSouth AsiaSouth Asia (IDA & IBRD)South SudanSpainSri LankaSub-Saharan Africa Sub-Saharan Africa (excluding high income)Sub-Saharan Africa (IDA & IBRD countries)SudanSwedenSwitzerlandSyrian Arab RepublicTajikistanTanzaniaThailandTogoTrinidad and TobagoTunisiaTurkeyTurkmenistanUkraineUnited Arab EmiratesUnited KingdomUnited StatesUpper middle incomeUruguayUzbekistanVenezuela, RBVietnamWorldYemen, Rep.ZambiaZimbabwe línea de tiempo (timeline):
En esta escala de tiempo se presenta un gráfico de 1972 y 2014 de Egypt, Arab Rep.. Los datos de 1971 están ausentes. El número de observaciones reales por fecha: 43.
Fuente (nombre):
Indicadores del desarrollo mundial
Fuente (organización):
IEA Statistics © OECD/IEA 2014 (http://www.iea.org/stats/index.asp), subject to https://www.iea.org/t&c/termsandconditions/
Categorías:
Energy & Mining, Trade
Se ha actualizado:
23 abr 2017 año
Los indicadores de los cambios de valor en los últimos años
Mínimo:
-121.787
1 ene 1981 año
Máximo:
1.539
1 ene 1975 año
A la fecha de observación
Valor
Cambio absoluto
El cambio con respecto al valor anterior
1 ene 1972 año
-109.713
-109.713
0.0%
1 ene 1973 año
-40.299
+69.413
-63.27%
1 ene 1974 año
-22.829
+17.471
-43.35%
1 ene 1975 año
1.539
+24.368
-106.74%
1 ene 1976 año
-35.344
-36.883
-2.4 mil%
1 ene 1977 año
-61.051
-25.707
72.73%
1 ene 1978 año
-85.609
-24.559
40.23%
1 ene 1979 año
-115.788
-30.179
35.25%
1 ene 1980 año
-105.437
+10.351
-8.94%
1 ene 1981 año
-121.787
-16.349
15.51%
1 ene 1982 año
-105.554
+16.233
-13.33%
1 ene 1983 año
-95.087
+10.467
-9.92%
1 ene 1984 año
-90.923
+4.165
-4.38%
1 ene 1985 año
-98.138
-7.215
7.94%
1 ene 1986 año
-99.597
-1.46
1.49%
1 ene 1987 año
-81.654
+17.944
-18.02%
1 ene 1988 año
-89.736
-8.083
9.9%
1 ene 1989 año
-79.773
+9.963
-11.1%
1 ene 1990 año
-74.793
+4.981
-6.24%
1 ene 1991 año
-70.132
+4.661
-6.23%
1 ene 1992 año
-72.091
-1.959
2.79%
1 ene 1993 año
-70.812
+1.279
-1.77%
1 ene 1994 año
-74.107
-3.295
4.65%
1 ene 1995 año
-79.219
-5.112
6.9%
1 ene 1996 año
-70.256
+8.964
-11.32%
1 ene 1997 año
-57.345
+12.91
-18.38%
1 ene 1998 año
-48.56
+8.786
-15.32%
1 ene 1999 año
-37.473
+11.086
-22.83%
1 ene 2000 año
-39.453
-1.979
5.28%
1 ene 2001 año
-30.804
+8.649
-21.92%
1 ene 2002 año
-25.096
+5.708
-18.53%
1 ene 2003 año
-25.498
-0.402
1.6%
1 ene 2004 año
-27.153
-1.655
6.49%
1 ene 2005 año
-18.115
+9.038
-33.28%
1 ene 2006 año
-26.853
-8.738
48.24%
1 ene 2007 año
-24.662
+2.192
-8.16%
1 ene 2008 año
-22.668
+1.994
-8.08%
1 ene 2009 año
-23.335
-0.667
2.94%
1 ene 2010 año
-18.984
+4.352
-18.65%
1 ene 2011 año
-16.467
+2.516
-13.26%
1 ene 2012 año
-9.876
+6.591
-40.02%
1 ene 2013 año
-4.972
+4.904
-49.66%
1 ene 2014 año
-6.814
-1.842
37.04%
Ranking de los países por los datos estadísticos actuales


Comentarios: